
TL;DR:
- Tracking organic sessions, assisted conversions, and content-attributed pipeline value best predicts content ROI across program stages.
- In early months, focus on visibility metrics; later, shift to pipeline contribution and revenue attribution for strategic insights.
The content marketing KPIs worth tracking fall into five objective groups: organic sessions and impressions (awareness), engagement time and scroll depth (quality), form fills and newsletter signups (lead generation), assisted conversions and content-attributed pipeline (revenue), and return visitor rate (retention). If you track nothing else, start with organic traffic growth rate month-over-month, assisted conversions in GA4, and content-attributed pipeline value from your CRM. Those three predict content ROI better than any other combination.
Here is the quick mapping:
| KPI | Business objective |
|---|---|
| Organic sessions (MoM growth) | Awareness |
| Search impressions and CTR | Awareness |
| Engagement time per session | Content quality |
| Scroll depth (75%+ threshold) | Content quality |
| Form fills / newsletter signups | Lead generation |
| Content-influenced leads | Lead generation |
| Assisted conversions | Conversion |
| Content-attributed pipeline value | Revenue |
| Content ROI multiple (Revenue ÷ Cost) | Revenue |
| Return visitor rate | Retention |
Program maturity shapes which KPIs matter most. In months 0–6, focus on organic rankings and traffic growth — you need visibility before you can measure conversion. From month 6–12, add lead generation and engagement metrics. At 12+ months, shift focus to pipeline contribution and revenue attribution, because that is when you have enough data to defend the budget.
Table of Contents
- Why tracking content marketing KPIs changes your decisions
- How do you choose the right KPIs for your program?
- What are the most important content marketing metrics to track?
- How do you connect content to pipeline and revenue?
- How do you set up tracking, dashboards, and reporting?
- How does a Shopify blog connect to e-commerce events?
- A copyable KPI measurement plan
- Key Takeaways
- What most measurement guides get wrong
- Blockpress makes content measurement faster for Shopify stores
- Further reading and authoritative resources
- FAQ
Why tracking content marketing KPIs changes your decisions
Tracking KPIs is not about building a prettier dashboard. It is about changing what you publish, where you invest, and how you justify the budget. Without measurement, content is a cost center. With the right metrics, it becomes a documented revenue driver.

The distinction between vanity metrics and decision-driving KPIs is where most programs go wrong. Pageviews and social shares feel good in a weekly standup, but they rarely change a publishing decision. Assisted conversions, on the other hand, tell you which articles are actually moving buyers through the funnel — and that changes everything from topic selection to internal linking strategy.
Top-performing B2B organizations attribute 30%–60% of their sales pipeline to content, and enterprise teams using multi-touch attribution with extended windows (up to 180 days) consistently surface a larger content contribution than last-click models show. That gap between what last-click reports and what multi-touch reveals is exactly why your KPI choices matter.
As your program matures, your KPI focus should shift deliberately:
- Months 0–6: Organic rankings, impressions, and traffic growth rate
- Months 6–12: Engagement time, lead conversion rate, and form fills
- Months 12+: Assisted conversions, content-attributed pipeline, and content ROI multiple
Pro Tip: Use a tiered reporting cadence to cut noise. Weekly for production metrics (articles published, word count), monthly for traffic and conversion, quarterly for business outcomes like pipeline and ROI. Mixing all three into one weekly report buries the signal.
How do you choose the right KPIs for your program?
Start with the business goal, not the metric. Ask: what decision will this KPI change? If you cannot name a specific decision, the metric is probably decorative.
A decision framework by maturity stage
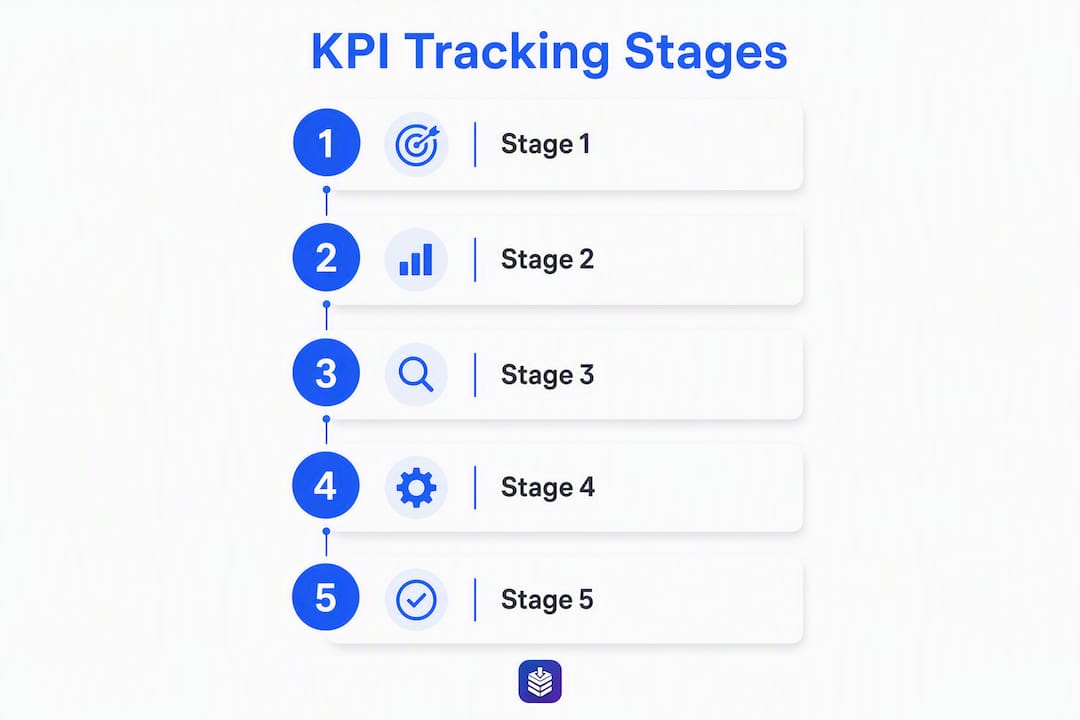
Stage 1 (0–6 months): Your program has no baseline. Pick 3–5 visibility KPIs: organic sessions, keyword rankings, search impressions, and CTR from Google Search Console. These tell you whether your content is getting indexed and found.
Stage 2 (6–12 months): You have traffic. Now measure quality and early conversion: engagement time, scroll depth, newsletter signup rate, and content-influenced leads. This is where you start connecting content activity to pipeline.

Stage 3 (12+ months): You have enough data for attribution. Add assisted conversions, content-attributed pipeline value, and the content ROI multiple (Revenue ÷ Cost). At this stage, tracking the wrong KPIs — like pageviews instead of pipeline — is the most common reason content teams lose budget.
Questions to ask before adding a KPI
- What decision will this metric change if it moves up or down?
- Who owns this metric and will act on it?
- Can you measure it reliably with your current tools?
- Does it connect to a business goal your leadership already cares about?
- Will you still track it in 12 months, or is it a short-term diagnostic?
Cadence recommendations
- Weekly: Content production velocity (articles published, drafts in progress)
- Monthly: Organic traffic, engagement metrics, lead conversion rates
- Quarterly: Pipeline contribution, content ROI, retention metrics
Pro Tip: Limit your active KPI set to 5–7 metrics. More than that and no one owns any of them. A small team tracking five KPIs consistently outperforms a large team tracking twenty metrics sporadically.
For a new program, a minimum viable KPI set is: organic sessions, engagement time, and one lead generation metric (form fill or newsletter signup). Add attribution metrics once you have 3–6 months of baseline data to compare against.
What are the most important content marketing metrics to track?
The catalog below groups KPIs by objective. For each, you get a definition, the formula or measurement method, and where to track it.
Reach and awareness metrics
| KPI | Definition | Formula / Measurement | Where to track | Action when it drops |
|---|---|---|---|---|
| Organic sessions | Visits from unpaid search | GA4 → Acquisition → Traffic acquisition, filter Organic Search | GA4 | Audit rankings, check for indexing issues |
| Search impressions | Times your content appeared in Google results | Search Console → Performance | Google Search Console | Expand topic coverage, fix crawl errors |
| CTR (click-through rate) | % of impressions that became clicks | Clicks ÷ Impressions × 100 | Search Console | Rewrite title tags and meta descriptions |
| Keyword rankings | Position for target keywords | Position tracking in Search Console or a rank tracker | Search Console | Update content, improve E-E-A-T signals |
Engagement and content quality metrics
Engagement time and scroll depth are better quality signals than the legacy bounce rate GA4 replaced. High engagement time often correlates with downstream conversions, making it a leading indicator worth watching monthly.
- Engagement time per session: GA4 reports this natively. A session with 2+ minutes of engagement time and 75%+ scroll depth is a strong quality signal.
- Scroll depth: Set up GA4 scroll events at 25%, 50%, 75%, and 100% thresholds. The 75% threshold is the most predictive of intent.
- Pages per session from content: GA4 → Engagement → Pages and screens, filtered by blog landing pages.
- Return visitor rate: GA4 → Retention report. Measures whether readers come back, a proxy for content authority.
Lead generation metrics
- Form fill rate: (Form submissions ÷ Article sessions) × 100. Track via GA4 form_submit event or your CRM's source tracking.
- Newsletter signup rate: (Signups ÷ Sessions) × 100. Set up a GA4 custom event on the signup confirmation.
- Content-influenced leads: Leads where a content touchpoint appeared in the journey. Pull from CRM with UTM source = organic or content.
- Cost per content lead: Total content spend ÷ Leads attributed to content.
Conversion and revenue metrics
These are the metrics that justify your content budget. Assisted conversions in GA4 show you which articles contributed to a conversion even when they were not the last touchpoint. That is the number that changes budget conversations.
- Assisted conversions: GA4 → Advertising → Attribution → Conversion paths. Filter by content/organic channel.
- Content-attributed pipeline value: CRM field showing pipeline sourced from content touchpoints. Requires UTM consistency and CRM mapping.
- Content ROI multiple: Revenue attributed to content ÷ Total content cost. A multiple above 1x is profitable; 3–6x is the target for mature programs tracking cluster-level performance.
- Revenue per article: Content-attributed revenue ÷ Number of articles in the attribution window.
Pro Tip: Assign a monetary value to micro-conversions like newsletter signups. If your average deal size and close rate are known, you can calculate an expected lead value and attach it to the signup event in GA4. This lets you report content-attributed revenue before a full sales cycle closes.
A common pitfall: UTM tags applied inconsistently across campaigns make attribution unreliable. Set a UTM naming convention on day one and enforce it across every channel. Consistency matters more than which attribution model you choose.
How do you connect content to pipeline and revenue?
Last-click attribution systematically undervalues content. A buyer who reads three blog posts over two months before requesting a demo will show the demo landing page as the conversion source in a last-click model. The blog posts get no credit. Content for both retail and B2B SaaS involves multiple sessions and touchpoints, so assisted conversions and multi-touch models are the right starting point.
Attribution models and when to use each
- First-touch: Credits the first content piece a buyer encountered. Best for measuring awareness and top-of-funnel content. Use it when you want to know which content starts journeys.
- Last-click: Credits the final touchpoint before conversion. Undervalues content almost always. Avoid as your primary model for content programs.
- Linear: Distributes credit equally across all touchpoints. Simple and defensible for early-stage programs without a dedicated analytics team.
- W-shaped: Weights first touch, lead creation, and opportunity creation most heavily. Best for B2B programs with defined pipeline stages.
Practical steps to implement attribution
- Set UTM parameters on every content distribution channel: email, social, paid promotion. Use a consistent naming convention (utm_source, utm_medium, utm_campaign, utm_content).
- Configure GA4 conversion events for the actions that matter: form_submit, newsletter_signup, add_to_cart, purchase. Mark them as conversions in GA4 settings.
- Map UTM data to your CRM. Pass utm_source and utm_medium as hidden fields on forms so your CRM records the content touchpoint at lead creation.
- Set attribution windows that match your sales cycle. For e-commerce, 30 days is often sufficient. For B2B SaaS with longer cycles, extend to 90–180 days.
- Review Conversion Paths in GA4 monthly. GA4 → Advertising → Attribution → Conversion paths shows you the full sequence of touchpoints before each conversion.
For micro-conversions, assign monetary value directly in GA4. If your average customer value is $1,200 and your lead-to-customer rate is 10%, a newsletter signup is worth approximately $120 in expected revenue. Attach that value to the signup event and your content ROI reports become defensible much earlier in the program lifecycle.
The combination of GA4, Shopify sales data, and CRM attribution gives the most complete picture for e-commerce content programs. Cookie restrictions and multi-session journeys mean no single tool captures everything, but the three together close most gaps.
How do you set up tracking, dashboards, and reporting?
Three setup steps get you operational: tag your content with UTMs, configure GA4 events, and connect GA4 to your CRM. Everything else builds on that foundation.
Dashboard template fields
A one-page content dashboard should include these columns:
- Source / channel (organic, email, social)
- Landing page / article URL
- Organic sessions (MoM)
- Engagement time (average per session)
- Leads generated (form fills + signups)
- Assisted conversions
- Content-attributed pipeline value
- Content ROI multiple
Keep it to one page. A dashboard with 30 metrics gets ignored; one with 8 gets reviewed every month.
Implementation timeline
- Week 1–2: Audit existing UTM tagging. Fix inconsistencies. Set up GA4 conversion events for your primary goals (form_submit, purchase, signup).
- Week 3–4: Connect GA4 to your CRM. Map UTM fields to lead source fields in your CRM (HubSpot, Salesforce, or equivalent).
- Week 5–6: Build the dashboard in Looker Studio or your CRM's reporting module. Pull GA4 and CRM data into one view.
- Week 7–8: QA the setup. Verify events fire correctly using GA4 DebugView. Check that UTM data is populating CRM lead records. Confirm conversion paths are showing content touchpoints.
Reporting cadence and ownership
- Weekly (content team): Articles published, drafts in progress, keyword rankings for new posts
- Monthly (content + marketing): Organic sessions, engagement metrics, lead conversion rates, assisted conversions
- Quarterly (leadership): Pipeline contribution, content ROI multiple, retention metrics
Assign one owner per metric. When a metric has no owner, it does not get acted on.
QA checklist before going live:
- UTM parameters follow the agreed naming convention
- GA4 events fire on form submits, signups, and key page interactions
- CRM lead records show utm_source and utm_medium fields populated
- Conversion paths in GA4 show organic/content as a touchpoint
- Dashboard data matches raw GA4 reports (spot-check three articles)
For deeper guidance on configuring GA4 for content programs, the analytics for content marketing guide covers SaaS-specific event setup and KPI selection in detail.
How does a Shopify blog connect to e-commerce events?
For Shopify merchants, the content-to-commerce funnel is specific: a reader lands on a blog post, clicks through to a product page, and (ideally) purchases. Enabling e-commerce event tracking in GA4 lets you see exactly what percentage of blog readers proceed to product pages — a micro-conversion that justifies the content investment.
The events to implement for a blog-to-product funnel:
- newsletter_signup: — A critical micro-conversion for Shopify stores. Assign monetary value based on your email list's average revenue per subscriber.
| Event | What it measures | Where to configure |
|---|---|---|
| view_item | Blog-to-product click rate | GA4 enhanced e-commerce |
| add_to_cart | Content-influenced cart additions | GA4 enhanced e-commerce |
| begin_checkout | Content-assisted checkout starts | GA4 enhanced e-commerce |
| purchase | Content-attributed revenue | GA4 + Shopify sales report |
| newsletter_signup | Email lead capture from blog | GA4 custom event |
Shopify's native GA4 integration handles most e-commerce events automatically once you connect your GA4 property through the Shopify admin. For blog-specific tracking, you need to add custom events that fire when readers click from a blog post to a product page. Measuring how blog traffic converts to sales requires that blog-to-product click event to be in place before you can report content-attributed revenue accurately.
Pro Tip: Use GA4's Exploration reports to build a custom funnel: Blog post view → Product page view → Add to cart → Purchase. This funnel shows you exactly where readers drop off and which articles have the highest product-click rates.
Blockpress gives Shopify merchants per-article performance analytics and live SEO scoring directly inside the editor, so you can see which posts are driving organic sessions and product clicks without switching between tools. That per-article view is what makes it practical to measure content ROI on Shopify at the individual article level rather than the channel level.
A copyable KPI measurement plan
Use this as your implementation checklist. Copy it into Notion, Asana, or a Google Doc and assign owners.
Step-by-step setup
- Configure GA4 conversion events — for your primary goals: form_submit, newsletter_signup, purchase, and any Shopify e-commerce events relevant to your funnel.
Sample targets by program stage
Early-stage program (0–6 months):
- Organic sessions: 10–20% MoM growth from a low baseline
- Engagement time: 90+ seconds average per session
- Newsletter signup rate: 1–2% of sessions
Mature program (12+ months):
- Content-attributed pipeline: 30–60% of total pipeline
- Content ROI multiple: 3x or higher
- Assisted conversion rate: measurable contribution in GA4 Conversion Paths
Minimal weekly/monthly routine
- Every week: Check keyword rankings for recently published posts. Flag any with impressions but low CTR for title tag updates.
- Every month: Pull organic sessions MoM, engagement time, and lead conversion rate. Compare against the prior month and the 90-day trend.
- Every quarter: Calculate content ROI multiple. Review which articles are driving assisted conversions. Decide which topics to expand and which to retire.
Key Takeaways
The most effective content measurement programs track 5–7 KPIs mapped to business goals, use assisted conversions instead of last-click attribution, and apply a tiered reporting cadence to separate production noise from strategic signal.
| Point | Details |
|---|---|
| Map KPIs to objectives | Choose 3–5 KPIs per goal: awareness, engagement, lead gen, conversion, and retention. |
| Match KPIs to program maturity | Focus on visibility metrics in months 0–6, then shift to pipeline and revenue at 12+ months. |
| Prioritize assisted conversions | Last-click attribution undervalues content; GA4 Conversion Paths shows content's real influence. |
| Assign monetary value to micro-conversions | Calculate expected lead value from deal size and close rate, then attach it to signup events in GA4. |
| Blockpress accelerates Shopify measurement | Per-article analytics and live SEO scoring inside Blockpress reduce the time to first content ROI report. |
What most measurement guides get wrong
The conventional wisdom says "track everything and let the data tell you what matters." That advice produces dashboards with 40 metrics and zero decisions. The programs that actually improve content performance do the opposite: they pick fewer metrics, assign clear owners, and review them on a fixed cadence.
Attribution is where I see the most wasted effort. Teams spend weeks debating whether to use W-shaped or data-driven attribution when the real problem is that their UTM tags are inconsistent and their CRM is not capturing lead source data at all. Fix the data quality first. A linear model with clean data beats a sophisticated model with dirty data every time.
The other mistake is treating KPI selection as permanent. Your KPIs should change as your program matures. A team still reporting on pageviews at month 18 has not updated its measurement framework since launch. Set a quarterly reminder to ask: are these KPIs still connected to a decision someone will make? If the answer is no, replace them.
One more thing worth saying plainly: the content ROI multiple (Revenue ÷ Cost) is the single number that protects content budgets in a downturn. Teams that cannot produce that number lose budget to channels that can. Building the attribution infrastructure to calculate it is not optional for a mature program. It is the difference between content being a line item that gets cut and a channel that gets defended.
Blockpress makes content measurement faster for Shopify stores
Per-article analytics is the gap most Shopify merchants hit when they try to measure content performance. GA4 shows you channel-level data; Shopify shows you sales. Neither tells you which specific blog post drove which product clicks and purchases. Blockpress closes that gap by putting per-article performance analytics, live SEO and UX scoring, and product-reference linking directly inside the Shopify editor.
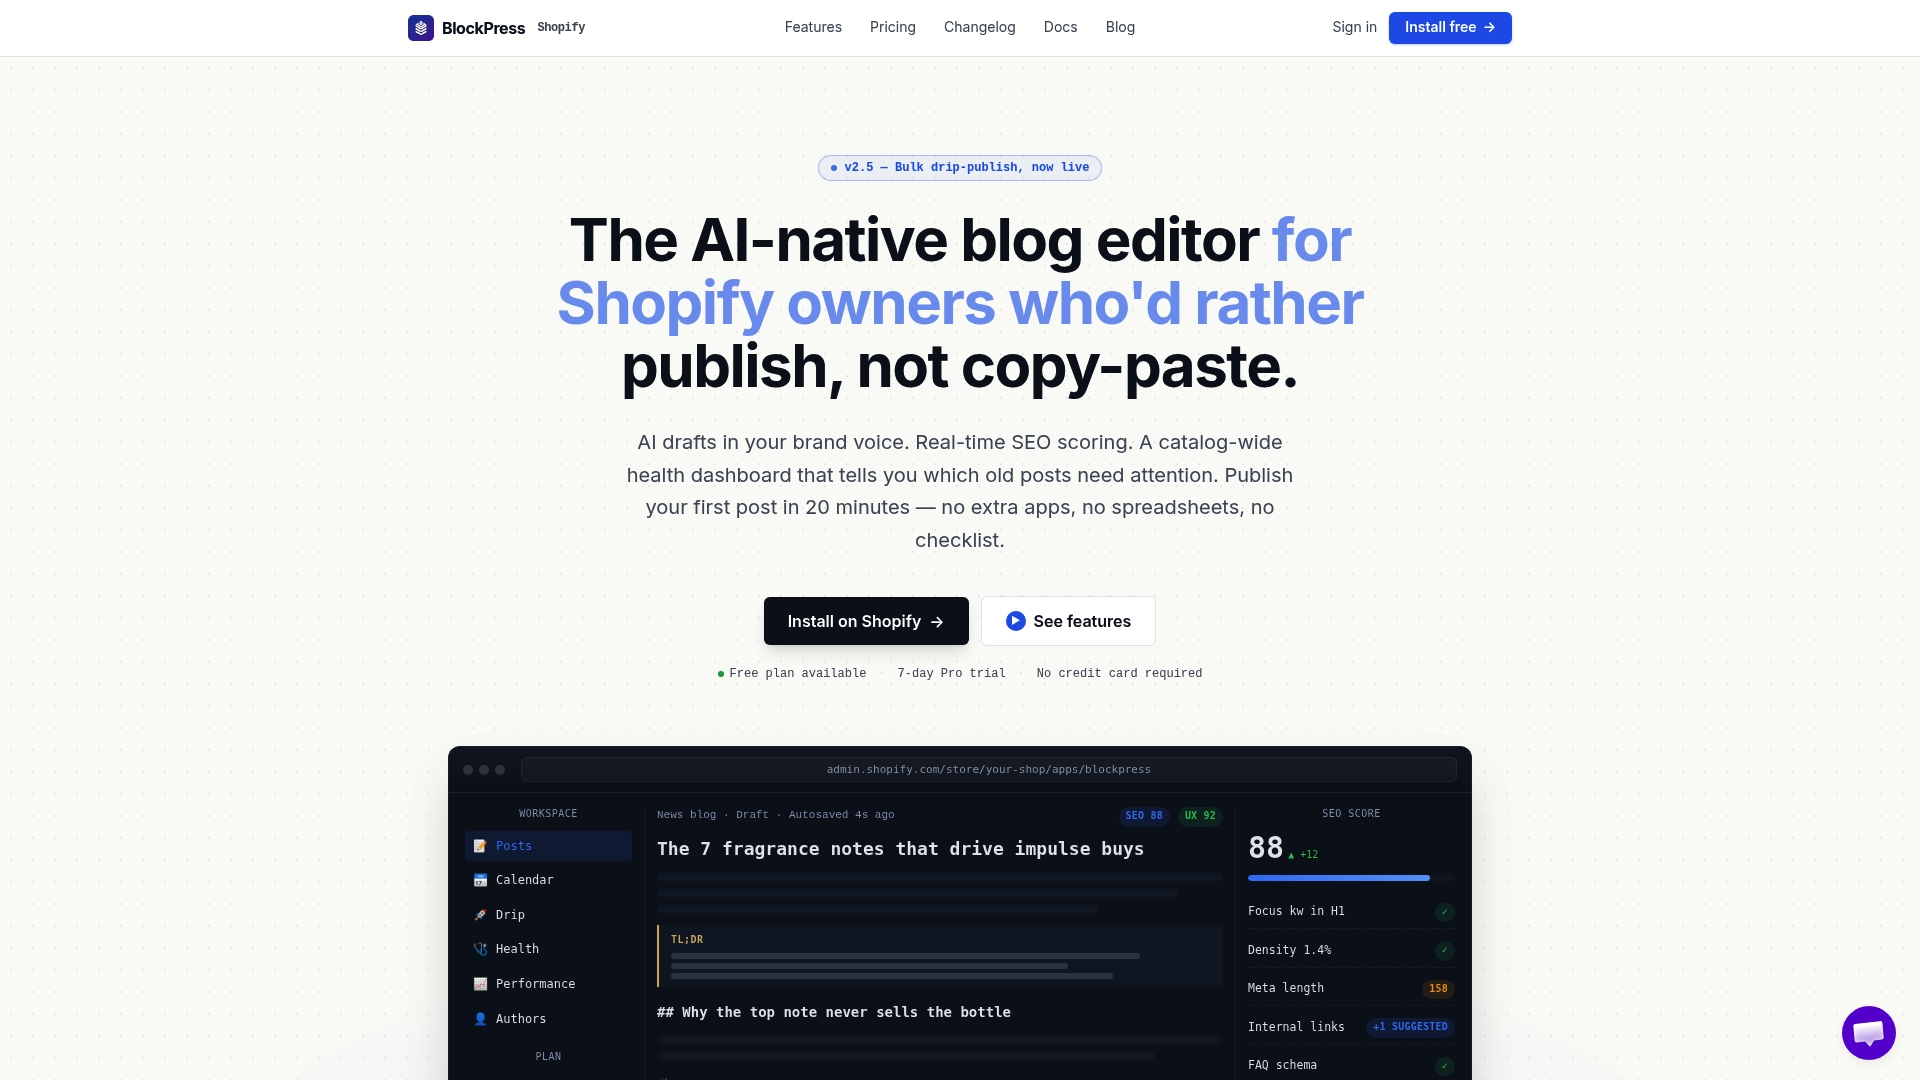
Three measurement capabilities Blockpress adds to your Shopify content workflow:
- Per-article performance analytics: See organic sessions, engagement signals, and conversion events at the individual article level, not just the blog channel level.
- Live SEO and UX scoring: Get real-time feedback on each post before publishing so you are optimizing for the KPIs that drive organic traffic from day one.
- Product-reference linking: Link products directly inside articles and track which product clicks originate from blog content, feeding your view_item attribution data.
If you are ready to cut the time between publishing and reporting, see the Blockpress features or check Blockpress pricing to find the plan that fits your store.
Further reading and authoritative resources
These are the most useful references for implementation details, benchmarks, and deeper study on content measurement:
- Google Search Console Performance Report — The primary source for impressions, CTR, and keyword ranking data. Start here for any organic visibility KPI.
- GA4 Event Tracking Documentation — Google's official guide to configuring events and conversions. Required reading before you instrument any custom events.
- How to Track Content Marketing ROI in E-Commerce — Covers the GA4 + Shopify + CRM integration stack and explains where tracking gaps occur and how to close them.
- Track LLM Traffic in GA4 — Practical guidance on segmenting AI-driven traffic in GA4, useful as LLM referral traffic becomes a measurable channel.
- Measuring Blog Performance for Shopify Store Owners — Shopify-specific guidance on e-commerce event tracking and blog-to-product funnel measurement.
FAQ
What are the most important content marketing KPIs to track?
The three that predict content ROI most reliably are organic traffic growth rate (month-over-month), assisted conversions in GA4, and content-attributed pipeline value from your CRM. Add engagement time and newsletter signup rate for a complete picture.
How do you measure content marketing performance in GA4?
Configure conversion events for your key goals (form_submit, purchase, newsletter_signup), then use GA4's Conversion Paths report under Advertising → Attribution to see which content touchpoints contributed to each conversion. For Shopify stores, enable enhanced e-commerce to track view_item and add_to_cart events from blog posts.
What is the difference between a vanity metric and a content KPI?
A vanity metric (pageviews, social shares) does not connect to a business decision. A content KPI changes what you publish, how you allocate budget, or how you report to leadership. If a metric moving up or down would not change any decision, it is a vanity metric.
How do you attribute revenue to content marketing?
Use assisted conversions and multi-touch attribution rather than last-click. Set consistent UTM parameters on all content distribution, pass UTM data to your CRM at lead creation, and review GA4 Conversion Paths monthly to see content's full contribution across the buyer journey.
When should you change your content marketing KPIs?
Review your KPI set quarterly. In months 0–6, prioritize visibility metrics like organic sessions and keyword rankings. From month 12 onward, shift to pipeline contribution and content ROI. If a KPI is not connected to a decision someone will make, replace it.