

TL;DR:
- Google PageSpeed Insights measures your site's Core Web Vitals using real-user data and provides prioritized fixes. Improving your mobile score and fixing the largest opportunity can significantly boost your page speed and search rankings. Focus on Core Web Vitals, especially Largest Contentful Paint, to ensure a better user experience and higher SEO performance.
PageSpeed Insights is Google's free tool that measures your site's Core Web Vitals using real-user data and produces a prioritized list of technical fixes. Run it right now: go to pagespeed.web.dev, paste your URL, click Analyze, and look at your Core Web Vitals status before anything else. A score of 90 or above is Good, 50–89 Needs Improvement, and below 50 is Poor. Fix the first item listed under Opportunities — that single change typically delivers the largest measurable gain.
Score bands at a glance: 90+ = Good, 50–89 = Needs Improvement, below 50 = Poor. These thresholds apply to both mobile and desktop reports per Google's official PSI documentation.
Poor page speed affects blog SEO directly. Google uses Core Web Vitals as a page experience signal, so a failing score is not just a UX problem — it costs you rankings.
Table of Contents
- How do you run a PageSpeed Insights test?
- Understanding the performance score and Core Web Vitals
- How do you read Opportunities and Diagnostics — and what should you fix first?
- How do you automate PageSpeed checks with the API?
- Key Takeaways
- The metric that most teams get wrong
- Blockpress gives Shopify merchants built-in performance visibility
- Useful sources and next reads
- FAQ
How do you run a PageSpeed Insights test?
Three methods cover most use cases: the web UI for quick checks, Chrome DevTools for local debugging, and the API for automation.
Running a test on pagespeed.web.dev
Go to pagespeed.web.dev, enter your full URL (including https://), and click Analyze. Results load in roughly 30–60 seconds. The report shows Field Data at the top (when available), followed by the Lighthouse Performance score, Core Web Vitals, and then the Opportunities and Diagnostics panels below. Always run the mobile report first — Google indexes and ranks based on the mobile version of your page, and mobile scores are almost always lower than desktop.
Running Lighthouse in Chrome DevTools
Open Chrome, navigate to the page you want to test, press F12 (or Cmd+Option+I on Mac), and click the Lighthouse tab. Select Performance, choose Mobile or Desktop, and click Analyze page load. This runs the audit locally, which is useful when you're testing a staging environment, a page behind a login, or a localhost build that PSI's cloud runner can't reach. The scoring methodology is identical to PSI's lab run.
Pro Tip: When comparing Lighthouse runs before and after a fix, always use Incognito mode and close other tabs. Browser extensions and cached resources can inflate or deflate scores by 5–10 points and make your results unreliable.
Using the PageSpeed Insights API
For automated checks, the PageSpeed Insights API returns a full JSON response including all metrics, scores, and audit details. Google recommends using an API key for any automated or frequent queries to avoid rate limiting. A basic request looks like this:
GET https://www.googleapis.com/pagespeedonline/v5/runPagespeed
  ?url=https://yoursite.com
  &strategy=mobile
  &key=YOUR_API_KEY
The JSON response includes lighthouseResult (lab data) and loadingExperience (field data from CrUX). Parse lighthouseResult.categories.performance.score for the 0–1 performance score (multiply by 100 for the familiar 0–100 range).
Understanding the performance score and Core Web Vitals
The PSI Performance score is a weighted composite of several Lighthouse metrics, not a direct average of your Core Web Vitals. Core Web Vitals are reported separately as pass/fail assessments based on your Field Data. Both matter, but they answer different questions: the score tells you how your page performs technically; the Core Web Vitals status tells you whether real users are having a good experience.
How do you read Opportunities and Diagnostics — and what should you fix first?
The Opportunities panel shows specific changes PSI estimates will reduce load time, with estimated savings in kilobytes or seconds. Diagnostics surfaces issues that don't have a direct time estimate but still affect performance. Both come from the Lighthouse audit.
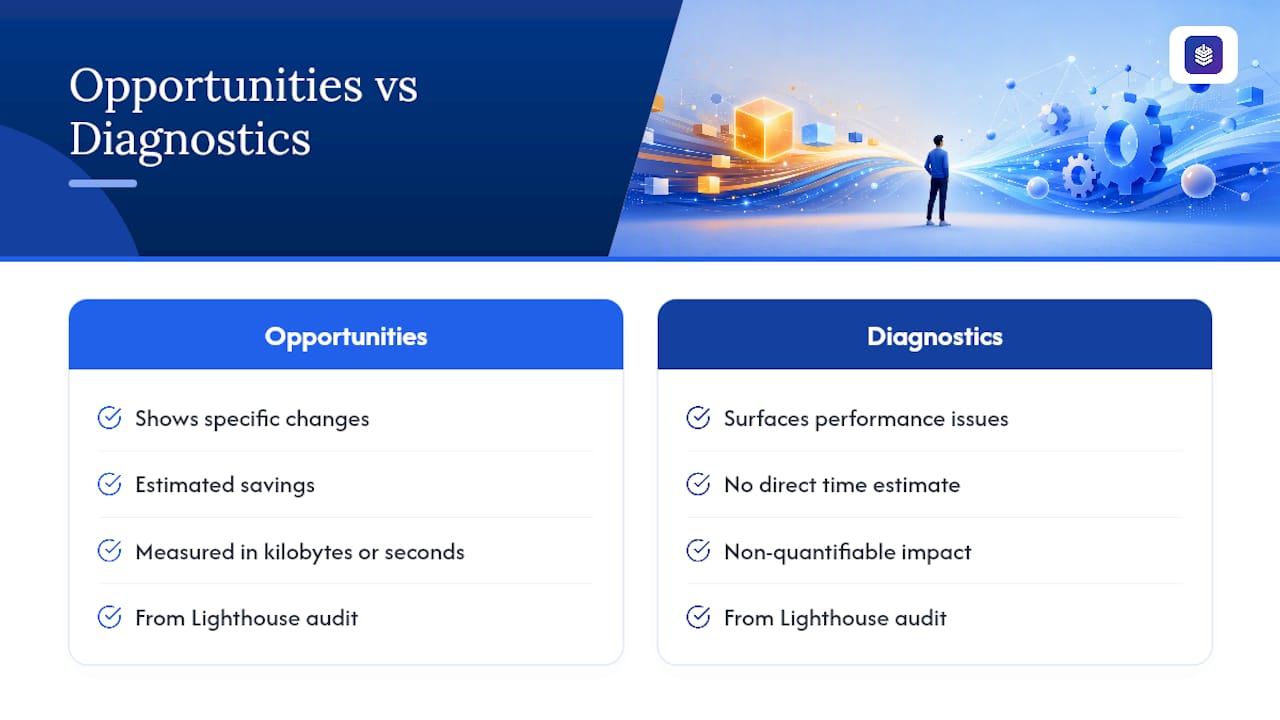
A practical prioritization approach, consistent with DebugBear's field-vs-lab guidance: fix what moves your failing Core Web Vital first, not what has the largest estimated savings in isolation.
How do you automate PageSpeed checks with the API?
Running PSI manually once a week is better than nothing, but it won't catch a regression introduced by a new app install or a theme update. The PageSpeed Insights API makes automated monitoring straightforward.
Why use an API key? Without one, requests are subject to rate limiting. With a free Google Cloud API key, you get a generous daily quota suitable for most monitoring setups. Register a key in the Google Cloud Console and append &key=YOUR_API_KEY to every request.
A minimal automation workflow
- Request: Send a
GETrequest to the PSI API with your URL, strategy (mobileordesktop), and API key. - Parse: Extract
lighthouseResult.categories.performance.score,loadingExperience.metrics.LARGEST_CONTENTFUL_PAINT_MS, andloadingExperience.overall_categoryfrom the JSON response. - Store: Write the values and a timestamp to a spreadsheet, database, or monitoring dashboard.
- Alert: Trigger a notification if the performance score drops below your threshold (e.g., below 80) or if any Core Web Vital shifts from Good to Needs Improvement.
Pro Tip: Test at the origin level (?url=https://yoursite.com/) alongside specific pages. Origin-level data reflects site-wide CrUX trends and catches regressions that page-level checks might miss if traffic is spread thin.
Best practices for automated PSI checks:
- Run checks on a schedule (daily or after each deployment), not continuously — PSI's lab data doesn't change between runs unless the page changes.
- Avoid querying the same URL more than a few times per hour; the lab environment needs time to stabilize between runs.
- Aggregate results over several days before concluding a fix worked. A single improved run could reflect server variance, not a real gain.
- For trend history beyond what PSI surfaces natively, consider exporting CrUX data via BigQuery or using a tool like WebPageTest for multi-location, multi-step tests that PSI's single lab run can't replicate.
Key Takeaways
PageSpeed Insights gives you both the real-user Core Web Vitals data Google uses for ranking and the Lighthouse diagnostics to fix what's failing — use Field Data to set priorities and Lab Data to confirm fixes work.
| Point | Details |
|---|---|
| Run mobile first | PSI's mobile report reflects Google's indexing environment; always start there. |
| Score bands matter | 90+ is Good, 50–89 Needs Improvement, below 50 is Poor — target Good on all Core Web Vitals. |
| Fix LCP before INP or CLS | LCP is most often the biggest gap; a single image optimization can move it from Poor to Good. |
| CrUX takes 28 days | After a fix, field data won't reflect the change immediately — use Lab Data to confirm progress sooner. |
| Blockpress for content monitoring | Blockpress's live UX scoring and per-article analytics complement PSI for Shopify merchants managing blog performance. |
The metric that most teams get wrong
Most teams treat the PSI Performance score as the primary goal and optimize toward it, but if you want expert help with technical strategies, Website Performance Optimization | Kirk & Co offers targeted services to improve your site speed. That's the wrong target. The score is a composite of Lighthouse lab metrics — it's useful for diagnosis, but it's not what Google uses for ranking. Your Core Web Vitals status in Field Data is what actually matters for search.
A page can score 78 in the lab and still pass all three Core Web Vitals in the field, because real users on fast connections and modern devices have a better experience than the throttled simulation. Conversely, a page can score 85 in the lab and fail LCP in the field because a specific image CDN performs poorly for users in certain regions.
The practical implication: don't chase the lab score. Fix the failing Core Web Vital in your Field Data, verify the fix in the lab, then wait for the 28-day CrUX window to confirm the field improvement. That cycle — measure, fix, verify, wait — is slower than most teams want, but it's the only one that produces real ranking gains.
For small teams and Shopify merchants specifically, the highest-leverage starting point is almost always site-wide: enable caching, convert images to WebP, and add explicit dimensions to every image. Those three changes address the most common LCP and CLS failures across every page simultaneously. Page-specific micro-optimizations — inlining critical CSS, preloading specific fonts — come after the site-wide baseline is solid. Trying to tune individual pages before fixing the foundation is how teams spend weeks on PSI without moving their rankings.
Blockpress gives Shopify merchants built-in performance visibility
Running PSI manually tells you what's broken technically. But for Shopify store owners publishing blog content, the gap is usually between knowing a page is slow and knowing which article is dragging down your content performance — and having the tools to fix the content side without leaving your store.
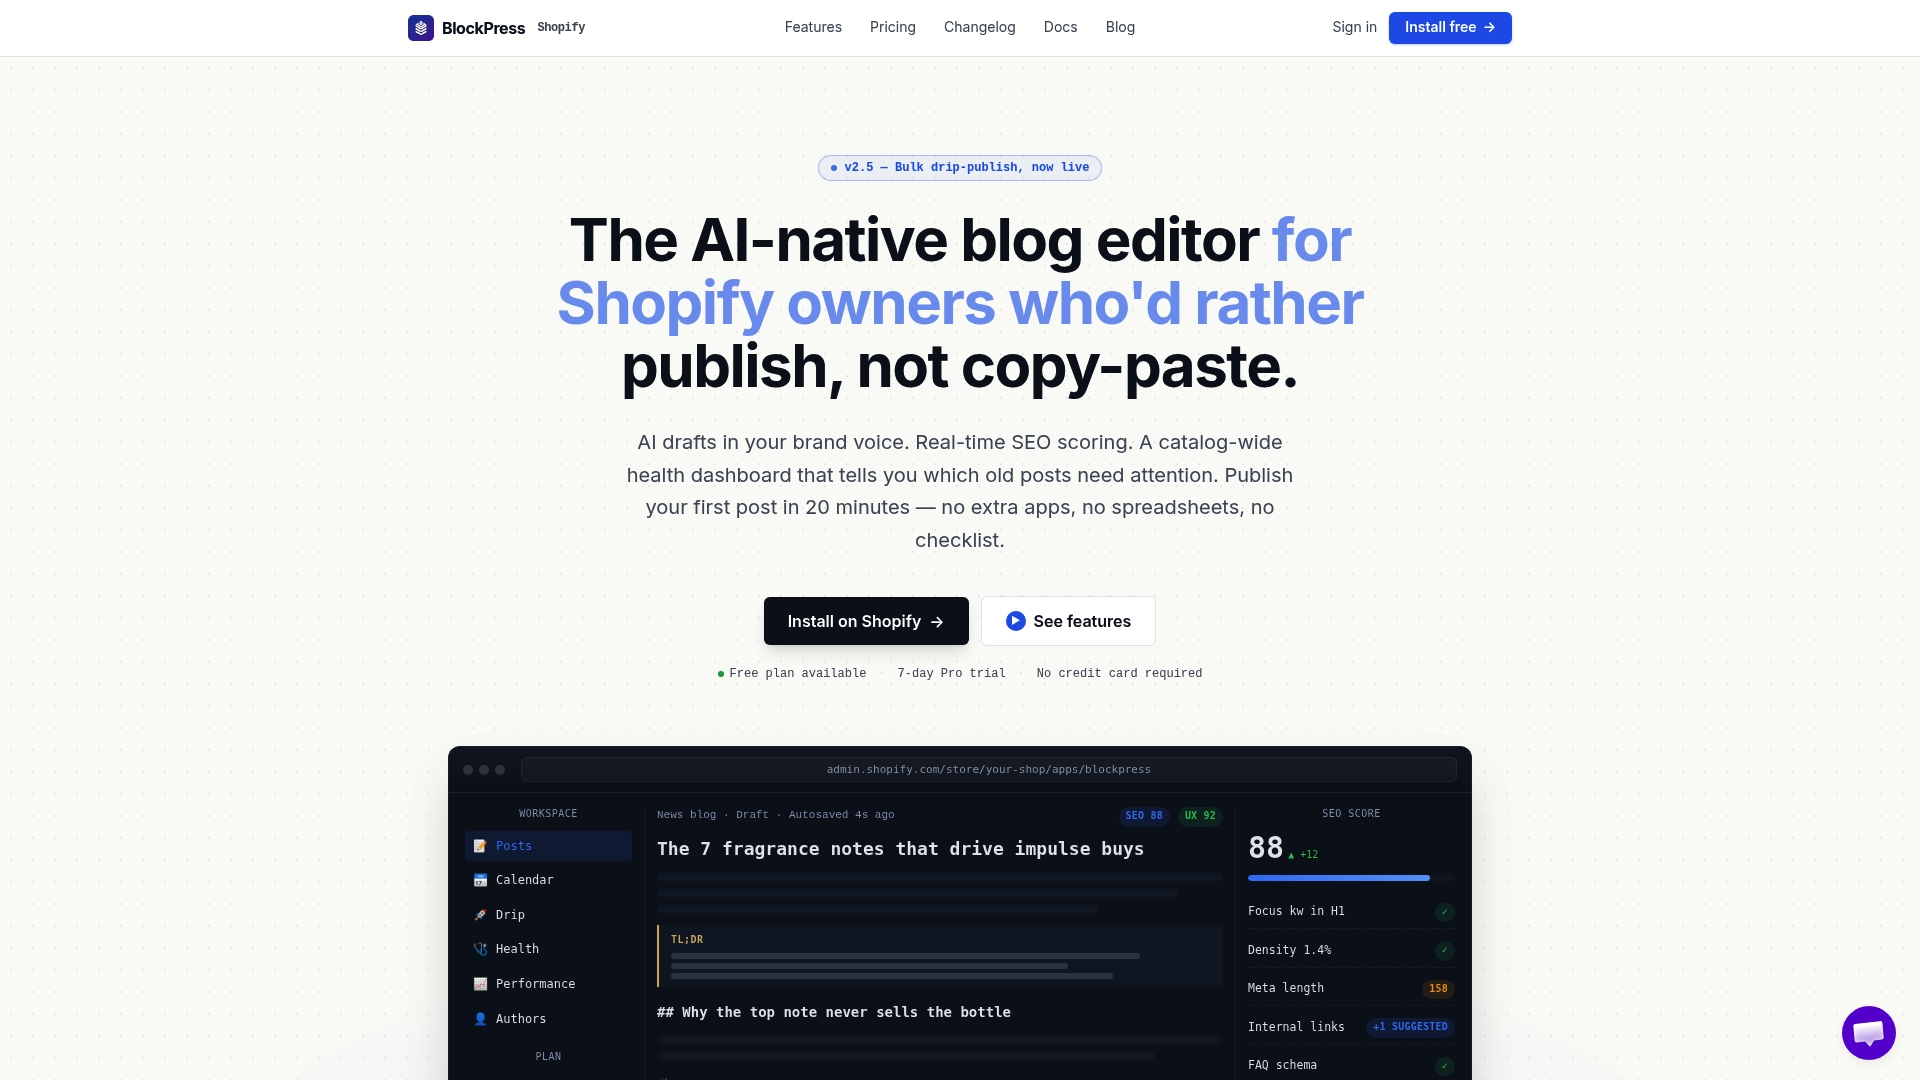
Blockpress is built directly into Shopify and gives you live SEO and UX scoring on every article as you write, per-article performance analytics, and content health audits — so you can see which posts need attention without running a separate audit tool. It pairs naturally with PSI: use PSI for technical diagnostics at the theme and platform level, and use Blockpress to monitor and improve the content and on-page signals that PSI doesn't cover. Merchants who need help fixing an underperforming Shopify blog will find that Blockpress surfaces the content-layer issues PSI misses entirely.
If you're managing a Shopify store and want an integrated content and monitoring workflow, try Blockpress — it's available directly through the Shopify App Store with a free plan to get started.
Useful sources and next reads
These are the official and independent resources worth bookmarking as you work through performance improvements:
- About PageSpeed Insights | Google for Developers
- PageSpeed Insights
- Lighthouse — Chrome Developers
- How to view Chrome UX Report data on PageSpeed Insights | Chrome for Developers
- Get started with PageSpeed Insights API | Google Developers
- How To Use PageSpeed Insights: A Detailed Guide | DebugBear
- Google PageSpeed Insights Guide: How to Read Reports and Improve Scores
- WebPageTest
FAQ
What is Google PageSpeed Insights?
PageSpeed Insights is a free Google tool that combines real-user performance data from the Chrome User Experience Report (CrUX) with Lighthouse lab audits to score your page's performance and suggest specific fixes.
Is Google PageSpeed Insights free?
Yes, the web UI at pagespeed.web.dev is completely free with no account required. The API is also free, though Google recommends registering an API key to avoid rate limits on automated queries.
How do you use Google PageSpeed Insights?
Go to pagespeed.web.dev, enter your URL, and click Analyze. Review your Core Web Vitals status in the Field Data section first, then work through the Opportunities panel to find the highest-impact fix.
How do you enable speed insights on a page?
You don't need to enable anything on your site — PSI pulls Field Data automatically from Chrome users who visit your page. If a page shows "No Data," it means CrUX hasn't collected enough traffic yet; rely on the Lighthouse lab report until field data accumulates over roughly 28 days.
What's the difference between mobile and desktop scores in PSI?
PSI runs separate audits for mobile and desktop using different device and network simulations. Mobile uses a throttled mid-range device and slow 4G connection, which is why mobile scores are typically lower. Since Google uses mobile-first indexing, always prioritize your mobile score.