

TL;DR:
- A content scoring framework helps marketing teams prioritize and improve content through repeatable, data-driven methods. Choosing the right model depends on team maturity, with simple rubrics outperforming overly complex systems due to higher adoption rates. Regular validation and stakeholder alignment ensure the scoring system effectively guides content decisions and aligns with marketing KPIs.
The fastest way for a marketing team to prioritize and improve content is a repeatable content-scoring framework. The five models marketers actually use are: the scorecard/rubric (spreadsheet-first, best for editorial teams starting out), the fit × engagement matrix (two-axis prioritization when you need to weigh audience fit against raw engagement), the 8-dimension rubric (comprehensive measurement across SEO, readability, information gain, and more), the composite quality score (a single 0–100 number for dashboards and A/B prioritization), and predictive scoring (machine-learning models that require 6–12 months of closed outcome data before they're worth building). Your three core data sources from day one: Google Analytics 4 (GA4), Google Search Console (GSC), and a content editor with live scoring like Blockpress.
Pick your framework by team maturity:
- Scorecard/rubric — best for teams starting with editorial quality; requires only a spreadsheet and 4–6 defined criteria
- Fit × engagement matrix — best when you need to rank content by audience fit vs. raw engagement simultaneously
- 8-dimension rubric — best for teams that need site-level consistency across SEO, readability, internal linking, and AI citability
- Composite quality score — best for reporting to stakeholders who want a single dashboard number
- Predictive scoring — only after you have sufficient closed-outcome data (6–12 months minimum)
Your first concrete step: Open a Google Sheet, pick one content type (blog posts are the easiest pilot), and pull three data columns: GA4 engagement time, GSC impressions, and a readability grade from Hemingway App. Score 10 existing pieces. That 90-minute exercise will reveal more about your content quality gaps than any audit report.
Table of Contents
- What content scoring frameworks marketers use and why they matter
- Which framework fits your team right now?
- How to build a content-scoring framework in one workshop
- Practical criteria and example weightings by content type
- How to operationalize scores: cadence, time decay, and validation
- Best practices and common mistakes in content scoring
- What your content scorecard spreadsheet should look like
- How to use the scorecard template in practice
- How marketing teams have used content scoring successfully
- How to align your scoring framework with marketing goals and KPIs
- How to get stakeholders aligned on scoring criteria and weights
- How to integrate qualitative feedback with quantitative scores
- Key Takeaways
- Why simple rubrics outperform complex scoring systems
- Useful sources and further reading
- FAQ
What content scoring frameworks marketers use and why they matter
Content scoring is a repeatable system that converts quality and performance signals into a comparable numerical score for each piece of content. Instead of relying on gut feel or vanity metrics, you assign weighted scores to criteria like SEO structure, readability, engagement depth, and conversion contribution, then roll them up into a single number you can act on.
Three immediate benefits make it worth the setup time:
- Diagnostic clarity: — A low score on a specific criterion tells you exactly what to fix. A blog post scoring 3/5 on internal linking gets a linking task, not a full rewrite.
Measurement works in three tiers. Discovery signals come from GSC: impressions, queries, and click-through rate tell you whether content is being found. Engagement signals come from GA4: engagement time, scroll depth, and events tell you whether readers are staying. Conversion signals come from your CRM and attribution layer: form fills, assisted conversions, and pipeline contribution tell you whether content is driving revenue. Connecting content strategy to SEO outcomes across all three tiers is what separates a scoring system from a simple traffic report.
Teams that implement structured scoring report higher first-approval rates and fewer revision cycles, according to Scale Growth Digital's content scoring rubric guide. The mechanism is straightforward: when writers know the scoring criteria before they draft, they produce content that already meets the standard.
Which framework fits your team right now?
The right content evaluation model depends on where your team is today, not where you want to be in a year. Here's a compact catalog.
Scorecard / rubric (spreadsheet-first) Structure: a spreadsheet with one row per content piece, columns for each criterion, 1–5 or 0–100 scores per criterion, and a weighted roll-up formula. This is the entry point for most teams. It requires no special tooling, takes one workshop to set up, and produces scores you can act on immediately. The trade-off: it's only as good as the criteria you define, and subjective criteria (brand voice, tone) can drift without calibration.
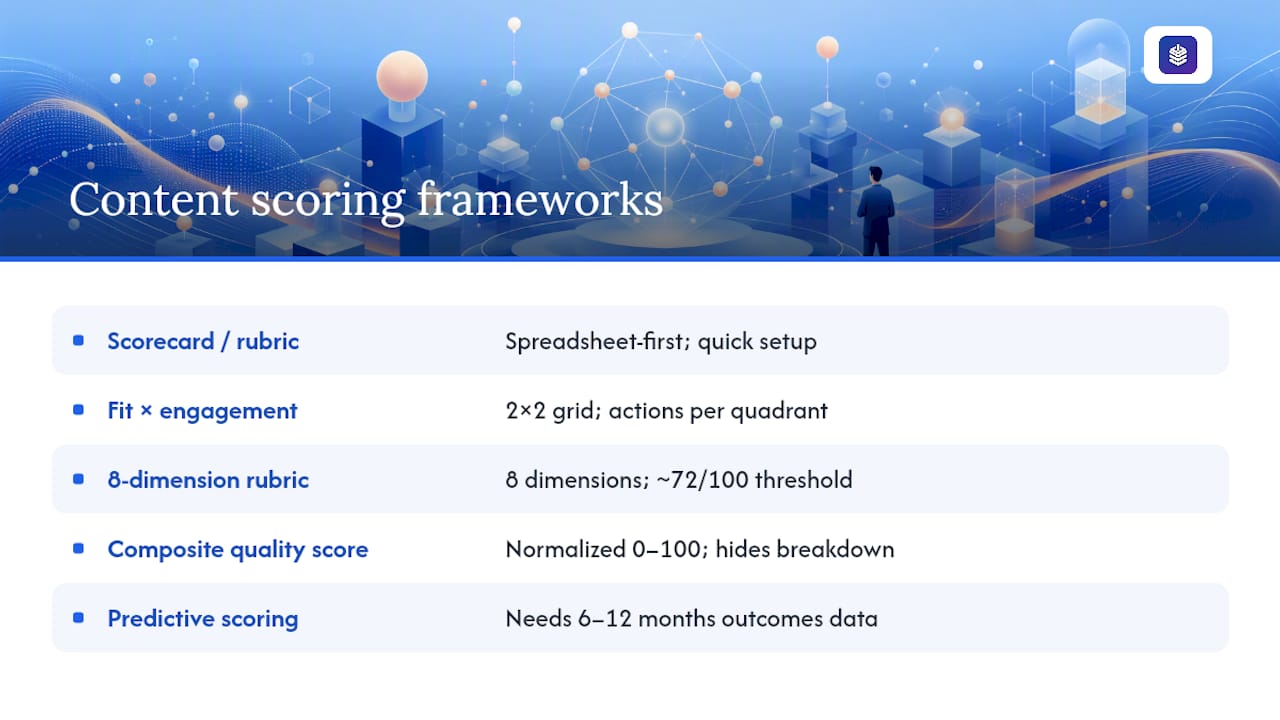
Fit × engagement matrix (two-axis model) Plot content on a 2×2 grid: audience fit on one axis, engagement depth on the other. High-fit, high-engagement content gets promoted; low-fit, high-engagement content gets repositioned; low-fit, low-engagement content gets retired. This model is borrowed from B2B lead scoring, where combining fit and engagement dimensions into separate axes prevents volume-only scoring from inflating low-quality pieces. Best for demand-generation teams evaluating content as a pipeline signal.
Multi-dimension (8-dimension) rubric Covers SEO compliance, information gain, readability, AI citability, data density, internal linking, brand relevance, and CTA effectiveness. The 8-dimension approach is effective for site-level consistency, with a typical publication threshold around 72/100. It's more diagnostic than a simple rubric because each dimension maps to a specific fix. The trade-off: it takes longer to score each piece, so it works best for high-value content like pillar pages and product landing pages.
Composite quality score (0–100) A single normalized number calculated from weighted sub-scores. Useful for dashboards, A/B prioritization, and stakeholder reporting. The composite score is the output of any of the above frameworks once you normalize to a common scale. Its weakness is that it obscures which dimension is dragging the score down, so always keep the per-criterion breakdown visible alongside the composite.
Predictive scoring (machine-learning) Assigns scores based on patterns in historical outcome data. Prerequisites: at minimum 6–12 months of content with tracked closed outcomes (conversions, pipeline, ranking changes). Without that data, predictive models overfit to noise. Validating thresholds against historical closed-won data is non-negotiable before trusting a predictive model for publishing decisions.
How to build a content-scoring framework in one workshop
The shortest path is a 90-minute pilot: score 10 representative pieces, calibrate your weights against the results, and you'll have a working rubric before the session ends.
-
Pick one content type. Blog posts are the easiest starting point because they have the most available performance data. Don't try to score blogs, emails, and product pages in the same rubric — the criteria and weights differ too much.
-
List 4–6 criteria. More than six criteria in a first rubric creates scoring paralysis. A rubric with 4–6 clear criteria and defined weights improves consistency and makes editorial feedback actionable. Common starting criteria: intent match, SEO structure, readability, engagement depth, internal linking, and CTA effectiveness.
-
Choose a scoring scale. Use 0–5 for simplicity or 0–100 for precision. A 0–5 scale is faster to score manually; a 0–100 scale integrates more cleanly with tool outputs like SurferSEO's content score.
-
Assign weights that sum to 100%. No criterion should fall below 5% (it's not worth measuring if it barely moves the needle). A typical blog rubric might weight intent match at 30%, SEO structure at 25%, engagement depth at 20%, readability at 15%, and internal linking at 10%.
-
Choose your data sources. Map each criterion to a tool: GSC for intent match (query data), SurferSEO or Semrush for SEO structure, GA4 for engagement depth, Hemingway App for readability, and a manual check for internal linking.
-
Set a publish/update threshold. A score below the threshold triggers an update brief; a score above it clears the piece for publication or marks it as healthy. A common blog publish gate is a moderate threshold indicating acceptable quality.
Scoring formula example:
Weighted score = Σ (criterion score / max score × weight)
For a blog post scored on a 0–5 scale:
| Criterion | Raw Score | Max | Weight | Weighted Points |
|---|---|---|---|---|
| Intent match | 4 | 5 | 30% | — |
| SEO structure | 3 | 5 | 25% | — |
| Engagement depth | 4 | 5 | 20% | — |
| Readability | 5 | 5 | 15% | — |
| Internal linking | 3 | 5 | 10% | — |
| Total | 100% | — |
Pilot and calibration checklist:
- Retro-score your top 10 performers and confirm they clear the threshold
- Run a 30-day pilot on new content using the rubric
- Compare scores to actual engagement and conversion outcomes after 30 days
- Adjust weights if top performers aren't clearing the threshold (don't lower the threshold)
Action triggers to wire in from day one:
- Score below threshold → create an update brief and assign an owner
- High score + low traffic → add a distribution task (promotion, internal linking push)
- High traffic + low conversion → flag for conversion rate optimization (CTA or landing page review)
Practical criteria and example weightings by content type
Different content types serve different goals, so their scoring criteria and weights should reflect that. A blog post is scored for discoverability and engagement; a marketing email is scored for deliverability and click-through; a product page is scored for conversion intent and trust signals.
Common scoring criteria with definitions:
- Intent match: Does the content answer the specific query or need it targets? Scored against GSC query data or keyword intent classification.
- Engagement depth: Time on page, scroll depth, and event completions from GA4.
- Accuracy / data density: Are claims supported by named sources, statistics, or examples? Thin content scores low here.
- Readability: Flesch-Kincaid grade level and sentence complexity, measured by Hemingway App.
- SEO structure: Title tag, meta description, heading hierarchy, keyword placement, and schema. Measured by SurferSEO or Semrush.
- CTA effectiveness: Is there a clear next step? Does it match the content's stage in the funnel?
- Internal linking: Does the piece link to and receive links from related content? Tracked manually or via a site crawler.
- Brand fit: Tone, voice, and positioning consistency with brand guidelines. Scored by a human reviewer.
Example weight tables by content type:
| Criterion | Blog Post | Marketing Email | Social Post | Product Page |
|---|---|---|---|---|
| Intent match | 30% | 20% | 25% | — |
| SEO structure | 25% | 5% | 5% | 20% |
| Engagement depth | 20% | 25% | — | 15% |
| Readability | 15% | 20% | 20% | 10% |
| CTA effectiveness | 5% | 25% | 10% | 15% |
| Internal linking | 5% | 5% | 5% | 5% |
Scoring thresholds by content type:
- Blog post publish gate: 70/100
- Marketing email send gate: 75/100
- Product page publish gate: 85/100
- Social post: 65/100 (lower threshold reflects shorter production cycle)
These thresholds align with the guidance from TeamBench's content scoring rubric, which recommends gates by content type and a minimum weight of 5% per criterion. For Shopify merchants, the on-page SEO elements checklist maps directly to the SEO structure criterion and gives you a ready-made sub-rubric.
Keep separate rubrics for each content type. A single universal rubric forces awkward compromises, like weighting internal linking heavily for social posts where it doesn't apply.
How to operationalize scores: cadence, time decay, and validation
Scores go stale. A blog post that scored 82/100 at publication may deserve a 61/100 six months later if engagement has dropped and competitors have published better content. Operationalizing your framework means building in a review cadence, applying time decay to behavioral signals, and validating the model against real outcomes.
Monthly review cadence is the baseline. The AMA Content Marketing Scorecard recommends updating data, reassigning 1–5 scores, reviewing the roll-up, and focusing actions on "At Risk" and "Off Track" items each month. Consistency matters more than a perfect rubric from day one.
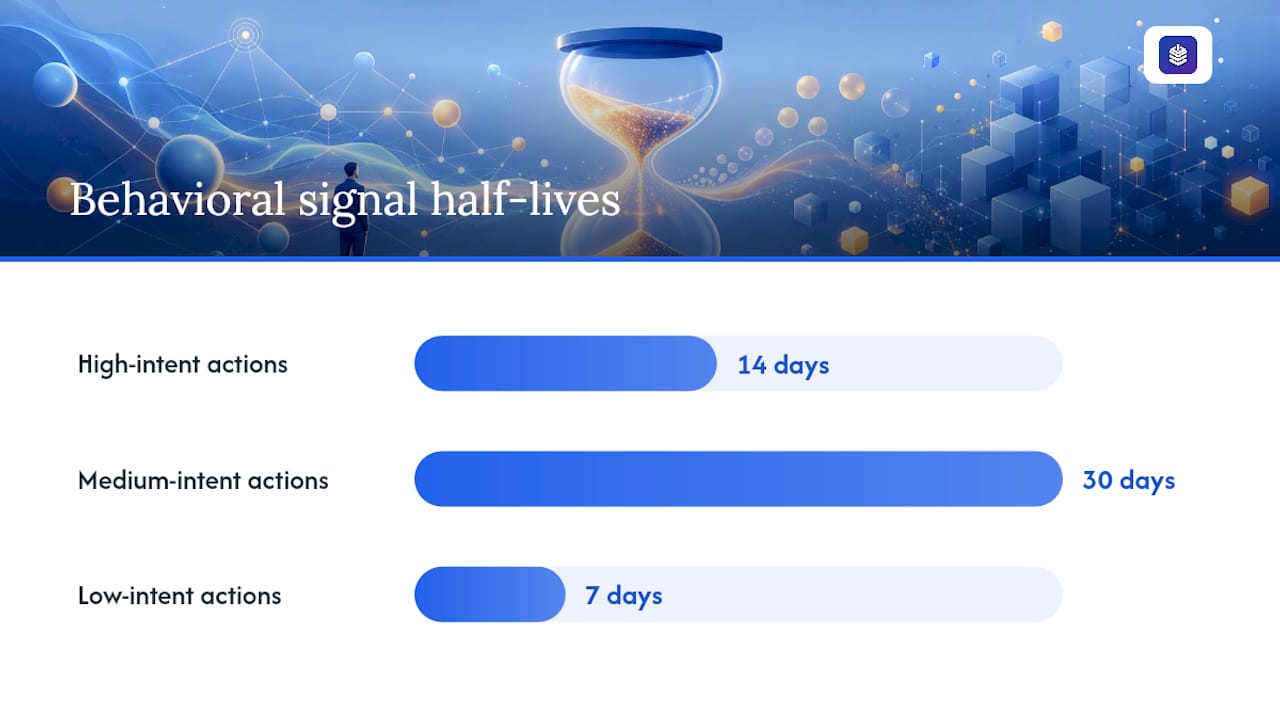
Time decay for behavioral signals prevents old engagement data from inflating scores on content that's no longer resonating. Apply exponential decay with half-lives calibrated to signal intent:
- High-intent actions (form fills, demo requests, purchase clicks): 14-day half-life
- Medium-intent actions (content downloads, email sign-ups): 30-day half-life
- Low-intent actions (page views, social likes): 7-day half-life
In a spreadsheet, implement decay with this formula: Decayed score = Raw score × 0.5^(days since action / half-life). A form fill from 28 days ago with a 14-day half-life retains 25% of its original score weight.
Calibration checklist:
- Retro-score your best 50 pieces using the proposed rubric
- Confirm that top performers clear your publication threshold
- If they don't, adjust weights rather than lowering the threshold
- Monitor the conversion rate of top-scored content over 60 days
- Recalibrate weights quarterly based on outcome data
This approach mirrors the calibration best practice from B2B lead scoring: retro-scoring top performers ensures your threshold actually separates winners from underperformers before you rely on it for publishing decisions.
Governance table (minimum viable version):
| Dimension | Owner | Cadence | Data Source | Acceptance Criteria |
|---|---|---|---|---|
| SEO structure | SEO lead | Pre-publish | SurferSEO | Score ≥ threshold |
| Engagement depth | Content analyst | Monthly | GA4 | Engagement time ≥ benchmark |
| Readability | Writer | Pre-publish | Hemingway | Grade ≤ 10 |
| Brand fit | Editor | Pre-publish | Human review | Score ≥ 4/5 |
| Composite roll-up | Content manager | Monthly | Scorecard | Trigger action if < threshold |
Pro Tip: For high-value content (pillar pages, product landing pages), run a two-scorer final pass pre-publish. Have the first reviewer score structural dimensions (SEO, internal linking, data density) before the second reviewer scores subjective ones (brand voice, readability). Scoring structural dimensions first prevents the halo effect — where a well-written piece gets inflated scores on SEO criteria it hasn't actually met.
Best practices and common mistakes in content scoring
Do:
- Start with 3 metrics. Complexity kills adoption. A three-criterion rubric that gets used consistently beats a ten-criterion rubric that gets abandoned after two weeks.
- Document scoring definitions with anchors. "A 5 for readability means Flesch-Kincaid grade 8 or below with no passive voice flags in Hemingway." Vague definitions produce inconsistent scores.
- Run closed-won validation before you trust the model. Retro-score your top performers and confirm the rubric identifies them correctly.
- Set clear publish gates and enforce them. A gate that gets overridden every time a deadline approaches is not a gate.
- Schedule rescoring. Content decays. Build a quarterly rescore into your content calendar.
Don't:
- Conflate activity with intent. Page views and social impressions are low-intent signals. Weighting them too heavily inflates scores for content that gets clicks but drives no pipeline. Implement negative signals where relevant: content that generates high bounce rates or zero conversions should score lower, not higher.
- Weight every metric equally by default. Equal weighting assumes every criterion matters the same amount, which is almost never true. A product page where CTA effectiveness is weighted the same as readability is a miscalibrated rubric.
- Skip retro-validation. Building a rubric without checking it against historical top performers is the single most common failure mode. You'll set a threshold that either flags everything as failing or passes everything, and neither is useful.
- Treat the score as the final decision. A score should trigger a diagnostic workflow, not an automated publishing decision. A piece scoring 68/100 on a 70/100 gate might still publish if the gap is in a low-stakes criterion.
Common misuse examples and quick fixes:
- Too many metrics causing paralysis: Cut to 4–6 criteria. Archive the rest in a "future expansion" tab.
- Over-reliance on a single proprietary tool score: SurferSEO's content score is one input, not the whole rubric. Pair it with GA4 engagement data and a human brand-voice check.
- Scores that never trigger action: Add an action tracker with owner, due date, and verification step. A score without an owner is just a number.
What your content scorecard spreadsheet should look like
A working scorecard lives in five tabs. Here's the exact layout to build in Google Sheets or Excel.
Tab structure:
| Tab | Purpose |
|---|---|
| Overview | Summary dashboard: total pieces scored, % above threshold, actions open |
| Raw data import | GA4 and GSC exports, pasted or API-pulled |
| Scorecard | One row per piece, all criteria columns, weighted score, status |
| Action tracker | Issues, owners, due dates, status, verification |
| Historical trends | Monthly score averages by content type, threshold changes over time |
Scorecard tab columns:
- URL, content type, date published, date last scored
- Criterion 1–N (raw score, 0–5 or 0–100)
- Raw metric columns (GA4 engagement time, GSC impressions, Hemingway grade)
- Weighted score (formula column)
- Status (Healthy / At Risk / Off Track)
- Owner, next action, due date
Sample formulas:
Normalize a 0–5 score to 0–100: =(raw_score / 5) * 100
Weighted average: =SUMPRODUCT(normalized_scores, weights)
Exponential decay for a behavioral metric: =raw_score * POWER(0.5, days_since / half_life)
Action tracker fields: Issue description, criterion affected, owner, due date, status (Open / In Progress / Verified), and a verification step (e.g., "Rescore after update; confirm score ≥ 70").
For Shopify merchants, Blockpress's per-article performance analytics reduce the manual step of pulling GA4 data into the Raw data import tab. The content ROI measurement guide for Shopify covers how to connect those analytics to business outcomes.
How to use the scorecard template in practice
The scorecard template above is designed to be copied and used in a single session. Open a blank Google Sheet, create the five tabs, and paste in your first 10 URLs. Score each piece manually against your 4–6 criteria using the data sources you've already mapped. The weighted score formula does the math; your job is to read the status column and assign actions.
For the first pilot, score 10 pieces across a mix of traffic levels: your top 3 performers by GA4 engagement time, your bottom 3 by GSC impressions, and 4 mid-range pieces. This spread ensures the rubric is calibrated against the full range of your content, not just your best work. After scoring, check whether your top performers by GA4 also score highest in the rubric. If they don't, your weights need adjustment.
Update the scorecard monthly. The AMA's content marketing scorecard process recommends a monthly review cycle: update the raw data, reassign scores, review the roll-up, and focus the action tracker on "At Risk" and "Off Track" items. Pieces that have been "Off Track" for two consecutive months get escalated to a full content audit.
How marketing teams have used content scoring successfully
The clearest pattern across teams that have made content scoring work is that they started narrow and expanded deliberately. A SaaS content team that begins by scoring only blog posts, with three criteria and a 70/100 gate, will have a functioning system within a month. A team that tries to score all content types simultaneously with eight criteria usually abandons the project before the first calibration.
One common implementation pattern: a B2B marketing team identifies that their top-converting blog posts all score above 75/100 on a simple rubric covering intent match, SEO structure, and engagement depth. They set 75 as the update trigger (not the publish gate), meaning any piece that drops below 75 in the monthly rescore gets an update brief. Within a quarter, the percentage of their blog inventory above 75 rises from roughly 40% to over 60%, and organic traffic from those updated posts increases measurably.
For ecommerce teams on Shopify, the pattern is similar but the criteria shift toward product-adjacent content: intent match against commercial queries, internal linking to product pages, and CTA effectiveness for driving add-to-cart behavior. The SEO-driven blog strategy examples show how scored improvements in structure and linking translate to ranking outcomes for product-focused content.
The teams that sustain scoring programs share one operational habit: they tie every low score to a named owner and a due date in the action tracker. Scores without owners are observations. Scores with owners are tasks.
How to align your scoring framework with marketing goals and KPIs
A content score that doesn't connect to a business KPI is a vanity metric with extra steps. Before you finalize your criteria and weights, map each criterion to a KPI your marketing team is already accountable for.
Start with your top three marketing KPIs (organic traffic, pipeline contribution, conversion rate are common). Then ask: which scoring criteria most directly predict performance on each KPI? Intent match and SEO structure predict organic traffic. Engagement depth and CTA effectiveness predict conversion rate. Data density and brand fit predict pipeline contribution through trust and authority signals.
Weight your criteria accordingly. A team whose primary KPI is organic traffic should weight intent match and SEO structure at 50–55% combined. A team focused on pipeline should weight engagement depth and CTA effectiveness more heavily.
Review the alignment quarterly. If your highest-scoring content isn't producing results on your primary KPI, the weights are miscalibrated. Adjust them based on the outcome data, not on what feels intuitively right. The technical SEO factors that affect ecommerce rankings are worth incorporating into your SEO structure criterion if organic traffic is your primary KPI.
How to get stakeholders aligned on scoring criteria and weights
The fastest way to kill a content scoring program is to build the rubric in isolation and then ask the rest of the team to use it. Stakeholder buy-in starts at the criteria-definition stage, not the rollout stage.
Run a 60-minute criteria workshop with the people who create, review, and use content: writers, editors, SEO leads, and at least one person from the demand-generation or sales team. Give everyone a list of 10–12 candidate criteria and ask them to vote on the 4–6 most important ones. Then ask each person to assign weights that sum to 100%. Average the weights across the group as a starting point.
The averaging step is important because it surfaces disagreements. If the SEO lead weights SEO structure at 40% and the brand editor weights it at 10%, that's a conversation worth having before you build the rubric, not after. Document the rationale for each final weight so new team members understand why the rubric is structured the way it is.
Revisit weights with stakeholders quarterly, especially after a significant shift in marketing goals or channel mix. A team that pivots from organic search to paid social will need to reweight engagement depth and brand fit relative to SEO structure.
How to integrate qualitative feedback with quantitative scores
Quantitative scores tell you what is happening; qualitative feedback tells you why. A blog post scoring 58/100 on engagement depth is a data point. An editor's note that "the introduction buries the main claim and readers are leaving before the payoff" is a diagnosis. You need both.
Build qualitative feedback into the scorecard as a structured field, not a free-text comment box. Use a 1–5 rating for each subjective criterion (brand fit, CTA clarity) with defined anchors, and add a single "key issue" field where the reviewer writes one sentence describing the primary problem. This keeps qualitative input comparable across reviewers and actionable for writers.
The content quality scoring approach from Growth-onomics recommends coupling quantitative roll-up scores with an action tracker that ties low scores to specific owners and deadlines. The qualitative "key issue" field feeds directly into the action tracker: the issue description becomes the task brief.
For subjective criteria, use two reviewers and average their scores. Single-reviewer subjectivity is the primary source of score drift over time. When two reviewers disagree by more than one point on a criterion, that's a signal that the scoring anchor for that criterion needs to be sharpened, not that one reviewer is wrong.
Key Takeaways
A content scoring framework works when it's simple enough to use consistently, calibrated against real outcome data, and wired to an action tracker that assigns ownership for every low score.
| Point | Details |
|---|---|
| Start with one content type | Pilot on blog posts with 4–6 criteria and a 70/100 publish gate before expanding to other formats. |
| Use GA4, GSC, and Hemingway as core inputs | These three tools cover discovery, engagement, and readability without requiring paid tooling to start. |
| Apply time decay to behavioral signals | High-intent actions use a two-week half-life; medium-intent about a month; low-intent about a week to keep scores current. |
| Validate against top performers | Retro-score your best 50 pieces and confirm they clear the threshold; adjust weights if they don't. |
| Blockpress for Shopify merchants | Blockpress surfaces live SEO/UX scoring and per-article analytics inside Shopify, reducing manual data wiring. |
Why simple rubrics outperform complex scoring systems
Most teams that build elaborate content scoring systems end up with a spreadsheet nobody opens. The ones that actually improve content quality share a counterintuitive trait: their rubrics are almost embarrassingly simple.
A three-criterion rubric with clear anchors, a monthly review cadence, and an action tracker with named owners will outperform a twelve-dimension model that requires four tools and a data analyst to run. The reason isn't that complexity is bad. It's that adoption is the constraint, not sophistication. A score that gets produced and acted on every month is worth infinitely more than a theoretically superior score that gets produced once and forgotten.
The dimension that most teams underestimate is AI citability. As AI-driven search channels (ChatGPT, Perplexity, Google's AI Overviews) become significant traffic sources, content that scores well on structural clarity, extractable answers, and internal linking gets cited more often. The 8-dimension rubric includes AI citability as a scored dimension for exactly this reason. Teams that add it now are building a scoring advantage that will compound as AI search grows.
The other underestimated factor is the reviewer order. Scoring brand voice before you've checked internal linking and SEO structure is a reliable way to give a well-written but structurally weak piece an inflated composite score. Always score mechanical dimensions first.
Useful sources and further reading
- Lead scoring guide
- Content Marketing Scorecard
- How to Build a Content Scoring Rubric That Works | TeamBench
- The Content Scoring Rubric: How to Judge Quality Before Publishing - Scale Growth Digital
- B2B Lead Scoring Model 2026: Template + MQL/SQL Thresholds
- 8-Dimension Content Scoring: Measure What Matters
- How to Use Content Scoring to Get Better Marketing Results
- Content quality scoring metrics
- B2B lead scoring examples
FAQ
What is a content scoring framework?
A content scoring framework is a repeatable system that assigns weighted numerical scores to content based on defined criteria (SEO structure, readability, engagement, conversion contribution), then rolls those scores into a single comparable number to guide publishing, updating, and prioritization decisions.
What is the 70/20/10 rule in marketing?
The 70/20/10 rule is a content investment guideline: allocate roughly 70% of content budget to proven formats that reliably perform, 20% to innovative approaches with moderate risk, and 10% to experimental content. It's a portfolio allocation model, not a scoring rubric, but it can inform how you weight content types in a scoring program.
What are the 5 C's of content marketing?
Definitions of the 5 C's vary across sources; a common version covers clarity, consistency, context, credibility, and conversion. These map reasonably well to scoring criteria: clarity to readability, consistency to brand fit, context to intent match, credibility to data density, and conversion to CTA effectiveness.
What is the 3-3-3 rule in marketing?
The 3-3-3 rule is an informal guideline suggesting content should make its main point in the first 3 seconds, deliver its core value in 3 minutes, and prompt a specific action within 3 steps. In a scoring context, it maps to CTA effectiveness and engagement depth criteria.
How do you validate a content scoring model?
Retro-score your top 50 performing pieces and confirm they clear your proposed publication threshold. If they don't, adjust the weights rather than lowering the threshold. Then monitor the conversion rate of top-scored content over 60 days to confirm the model predicts real outcomes, as recommended in B2B lead scoring calibration guidance.