
Bounce rate in blog analytics is the percentage of sessions that didn't meet GA4's "engaged session" criteria — meaning the visitor left without spending 10+ seconds on the page, triggering a conversion event, or viewing a second page. Because engagement rate and bounce rate always add up to 100%, your real job as a blogger is to watch engagement rate rise, not just watch bounce rate fall. Tools like Blockpress surface per-article performance data so you can act on these signals without toggling between separate dashboards.
Table of Contents
- What is bounce rate in blog analytics, and how has the definition changed?
- Why bounce rate can mislead you as a blogger
- Which metrics actually tell you if your blog post is working?
- How to set up GA4 to measure engagement accurately
- Tactical steps to lower bounce rate and raise real engagement
- What are realistic bounce and engagement rate ranges for blogs?
- Post-publish analytics checklist for bloggers
- Key Takeaways
- Bounce rate tells you less than you think
- Blockpress gives Shopify bloggers analytics and authoring in one place
- Useful sources
- FAQ
What is bounce rate in blog analytics, and how has the definition changed?
The definition shifted significantly when Google replaced Universal Analytics (UA) with Google Analytics 4 (GA4), and the two numbers are not comparable.

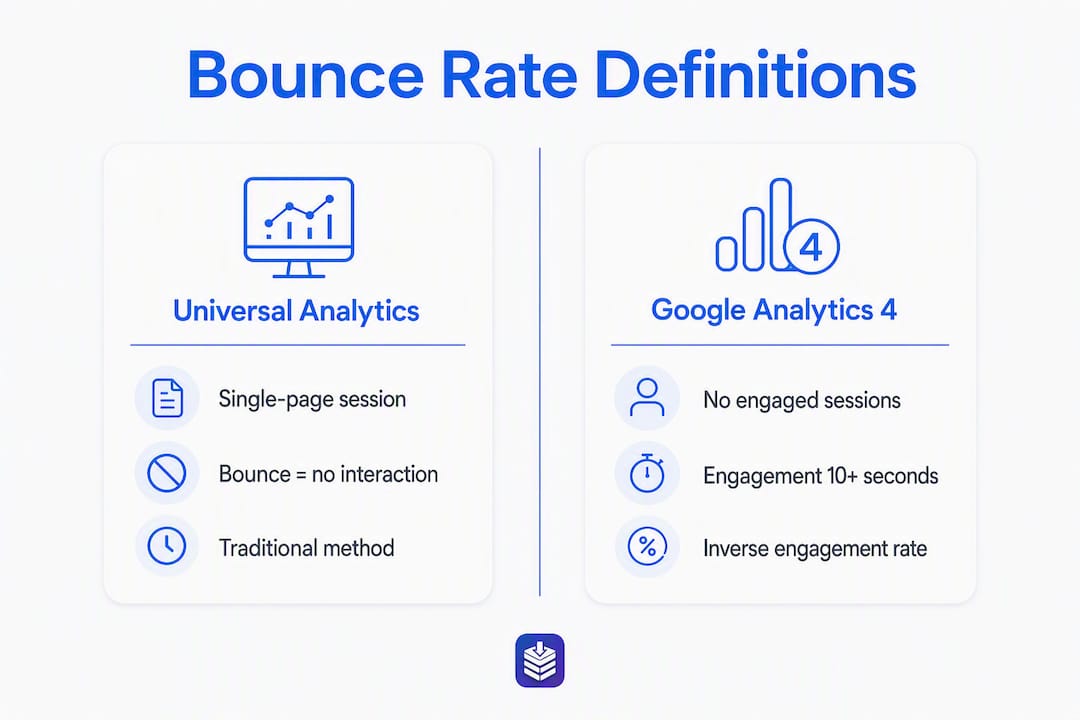
Under Universal Analytics, any single-page session counted as a bounce — full stop. A reader who landed on your 3,000-word guide, read every word, and closed the tab was recorded identically to someone who clicked the back button after two seconds.
Under GA4, a session is "engaged" if it meets at least one of three conditions:
- Lasts longer than 10 seconds
- Includes a conversion event
- Includes 2 or more pageviews or screen views
Bounce rate in GA4 is simply the inverse of engagement rate: sessions that met none of those criteria. That structural change means GA4 typically shows lower bounce rates for the same content than UA did, because a 10-second read now counts as engaged.
| Dimension | Universal Analytics | GA4 |
|---|---|---|
| Bounce definition | Any single-page session | Session with no engagement signal |
| Minimum engagement signal | Second pageview required | 10 sec, conversion, or 2nd pageview |
| Default metric shown | Bounce rate | Engagement rate |
| Comparability | Not comparable to GA4 | Not comparable to UA |
One practical example: a visitor reads your product review post for 45 seconds and leaves. UA records a bounce. GA4 records an engaged session. Same visitor, same behavior, opposite metric outcome.
Why bounce rate can mislead you as a blogger
Bounce rate is a blunt instrument — it collapses very different reader behaviors into a single number. Three scenarios show why:
Scenario 1: An answer-driven blog post. Someone searches "how long does Shopify take to process a refund," reads your 400-word answer, gets what they need, and leaves. High single-page exits are expected and acceptable here — the post did its job. A 75% bounce rate on this page is not a problem.
Scenario 2: A checkout landing page. High bounce on a page designed to push visitors deeper into your store is a real signal. These visitors should be clicking product links or navigating to collections. If they're not, something is broken — the offer, the copy, or the page load time.
Scenario 3: A tracking-broken page. If your GA4 tag fires twice, every session looks engaged (two "pageviews" from one tag). Bounce drops to near 0%. That's not a win; it's a measurement error.
Pro Tip: Filter bounce rate by traffic source and page type before drawing conclusions. Organic search traffic to informational posts almost always shows higher single-page exits than email or direct traffic — and that's normal.
Which metrics actually tell you if your blog post is working?
Pair bounce rate with these signals for a complete picture of content consumption and reader intent:
- Average engagement time: How long readers actively interact with the page. For long-form posts, aim for 2+ minutes. Short posts may see 45–90 seconds and still perform well.
- Scroll depth: What percentage of the page readers reach. A post where 80% of readers drop off at the fold needs a stronger opening or a better content structure.
- Return visitor rate: Readers who come back signal genuine trust. This matters especially for blogs tied to product launches and brand-building content.
- Pages per session: Readers who visit more than one page are moving through your funnel. Internal links drive this number.
- Conversion events: Newsletter signups, product link clicks, add-to-cart actions. These are the clearest signal that your content is working for your business goals.
For measuring broader website success, these metrics map directly to three blog goals: discovery (scroll depth, organic sessions), education (average engagement time, return visitors), and conversion (event completions, pages per session).
How to set up GA4 to measure engagement accurately
GA4 prioritizes engagement rate in its default UI; bounce rate is a derived metric you must add manually to standard reports or Explorations. Here's how to get the setup right:
1. Find engagement metrics. Go to Reports → Engagement → Pages and Screens. Add "Bounce rate" as a secondary metric by customizing the report columns.
2. Adjust the engaged-session threshold. The default 10-second threshold can misclassify readers of long-form content. Raise it in Admin → Data Streams → Tag settings to 30 or 60 seconds for posts over 1,500 words.
3. Mark key blog events as conversions. In GA4, go to Admin → Events and toggle these as conversions:
- Scroll depth (75% or 90% thresholds)
- Newsletter signup
- Product link click
- Time-on-page milestone (e.g., 60 seconds)
4. Debug extreme values. A 0% or 100% bounce rate almost always signals a tracking error — duplicate tags or non-firing events. Check for tag duplication in your Shopify theme or Google Tag Manager container.
Pro Tip: Use Google Tag Manager's test mode alongside GA4 DebugView to confirm scroll-depth and CTA-click events are firing correctly before you publish. Catching a broken event on day one saves weeks of bad data.
Tactical steps to lower bounce rate and raise real engagement
Start with the changes that move the most meaningful metrics, not just the bounce number.
- Improve page load speed. Slow pages lose readers before the 10-second engagement threshold. Compress images and audit your Shopify theme scripts. Check technical SEO factors that affect load time.
- Add contextual internal links. Link to related posts within the first 300 words. Readers who click an internal link immediately become engaged sessions and extend pages per session.
- Insert inline CTAs. A newsletter signup or product recommendation mid-article keeps readers on the page and creates a conversion event.
- Add a related-articles widget. Place it at the end of every post. Readers who finish an article are your most qualified audience for a second click.
- Set scroll-depth events. Without them, a reader who scrolls 90% of your post and leaves looks identical to someone who bounced immediately.
A realistic before/after: add a 75% scroll-depth event and two internal links to an existing post. Within two to four weeks, expect engagement rate to rise and average engagement time to increase as GA4 now counts deep readers as engaged. Monitor event completions in GA4 Explorations to confirm the events are firing. For a full optimization checklist, see how to optimize existing Shopify blog posts for SEO.
Improving user engagement consistently comes down to matching content depth to reader intent, then making it easy for satisfied readers to take a next step.
What are realistic bounce and engagement rate ranges for blogs?
Many content sites show engagement rates between roughly 35% and 65%, which means bounce rates in the same range. But page type shifts those numbers significantly.
| Page type | Typical GA4 engagement rate | Bounce rate range | Key caveat |
|---|---|---|---|
| Long-form informational post | 45%–65% | 35%–65% | Organic search traffic skews lower engagement |
| Single-answer / FAQ post | 20%–40% | 60%–80% | High bounce is expected and acceptable |
| Product-related blog post | — | 30%–65% | Internal links and CTAs drive this up |
| Paid traffic landing page | 30%–65% | 45%–70% | Audience match matters most |
Build your own baselines by page type rather than chasing an industry average. Pull 90 days of data in GA4 Explorations, segment by page type and traffic source, and set targets relative to your own historical performance. That approach tells you far more than any benchmark.
Post-publish analytics checklist for bloggers
Run these checks within 72 hours of publishing a new post:
- Verify your GA4 tag is firing. Use GA4 DebugView or Tag Assistant to confirm one pageview event per session, not two.
- Smoke test key events. Scroll to 75%, click your CTA, and sign up for your newsletter — then confirm each event appears in DebugView.
- Check engagement rate at 24–48 hours. A rate below 20% on an informational post usually points to a tracking issue or a severe audience mismatch.
- Sample a session replay. Tools like Microsoft Clarity (free) show where readers drop off and whether your layout is causing friction.
- Prioritize fixes by impact. Fix tracking bugs first. Then address page speed. Then refine copy and CTAs.
Pro Tip: Create a GA4 Exploration report filtered to new posts published in the last 7 days. Bookmark it. Checking it becomes a 5-minute habit that catches problems before they compound.
Key Takeaways
Bounce rate in GA4 is the inverse of engagement rate — your primary lens for blog performance should be engagement rate, not bounce rate alone.
| Point | Details |
|---|---|
| GA4 redefines bounce rate | A session is engaged if it lasts 10+ seconds, has a conversion event, or includes 2+ pageviews — bounce is what's left. |
| UA and GA4 numbers don't compare | GA4 typically shows lower bounce rates for the same content; never benchmark one against the other. |
| High bounce can be acceptable | Answer-driven and FAQ posts routinely see 60%–80% bounce; judge by page type and traffic source, not a universal target. |
| Pair bounce with better metrics | Average engagement time, scroll depth, return visitor rate, and conversion events reveal what bounce rate hides. |
| Blockpress surfaces this data natively | Per-article analytics inside Blockpress show engagement signals without leaving your Shopify editor. |
Bounce rate tells you less than you think
Most bloggers treat a rising bounce rate like a fire alarm. They redesign pages, rewrite headlines, and add pop-ups — then watch engagement stay flat. The problem isn't the bounce rate; it's that they're optimizing for the wrong signal.
The more useful question is: did the reader get what they came for? A 70% bounce rate on a well-written answer post, with an average engagement time of 90 seconds and a 40% scroll depth to the bottom, is a success. That reader found your content, consumed it, and left satisfied. GA4's engagement model captures that. UA never did.
What actually deserves attention is the combination of low engagement time and high bounce on a post where you expected deeper reading. That pairing, especially on organic traffic, usually means a content-intent mismatch — the post ranks for a keyword but doesn't deliver what the searcher expected. Fix the content before you touch the analytics setup.
The bloggers who improve fastest are the ones who stop chasing a single number and start reading their data as a story: who came, what they did, and whether they left better informed than when they arrived.
Blockpress gives Shopify bloggers analytics and authoring in one place
Most Shopify store owners piece together their blog analytics from GA4, a separate SEO tool, and a spreadsheet. Blockpress replaces that stack with per-article performance analytics, live SEO and UX scoring, and internal-link suggestions built directly into the Shopify editor.
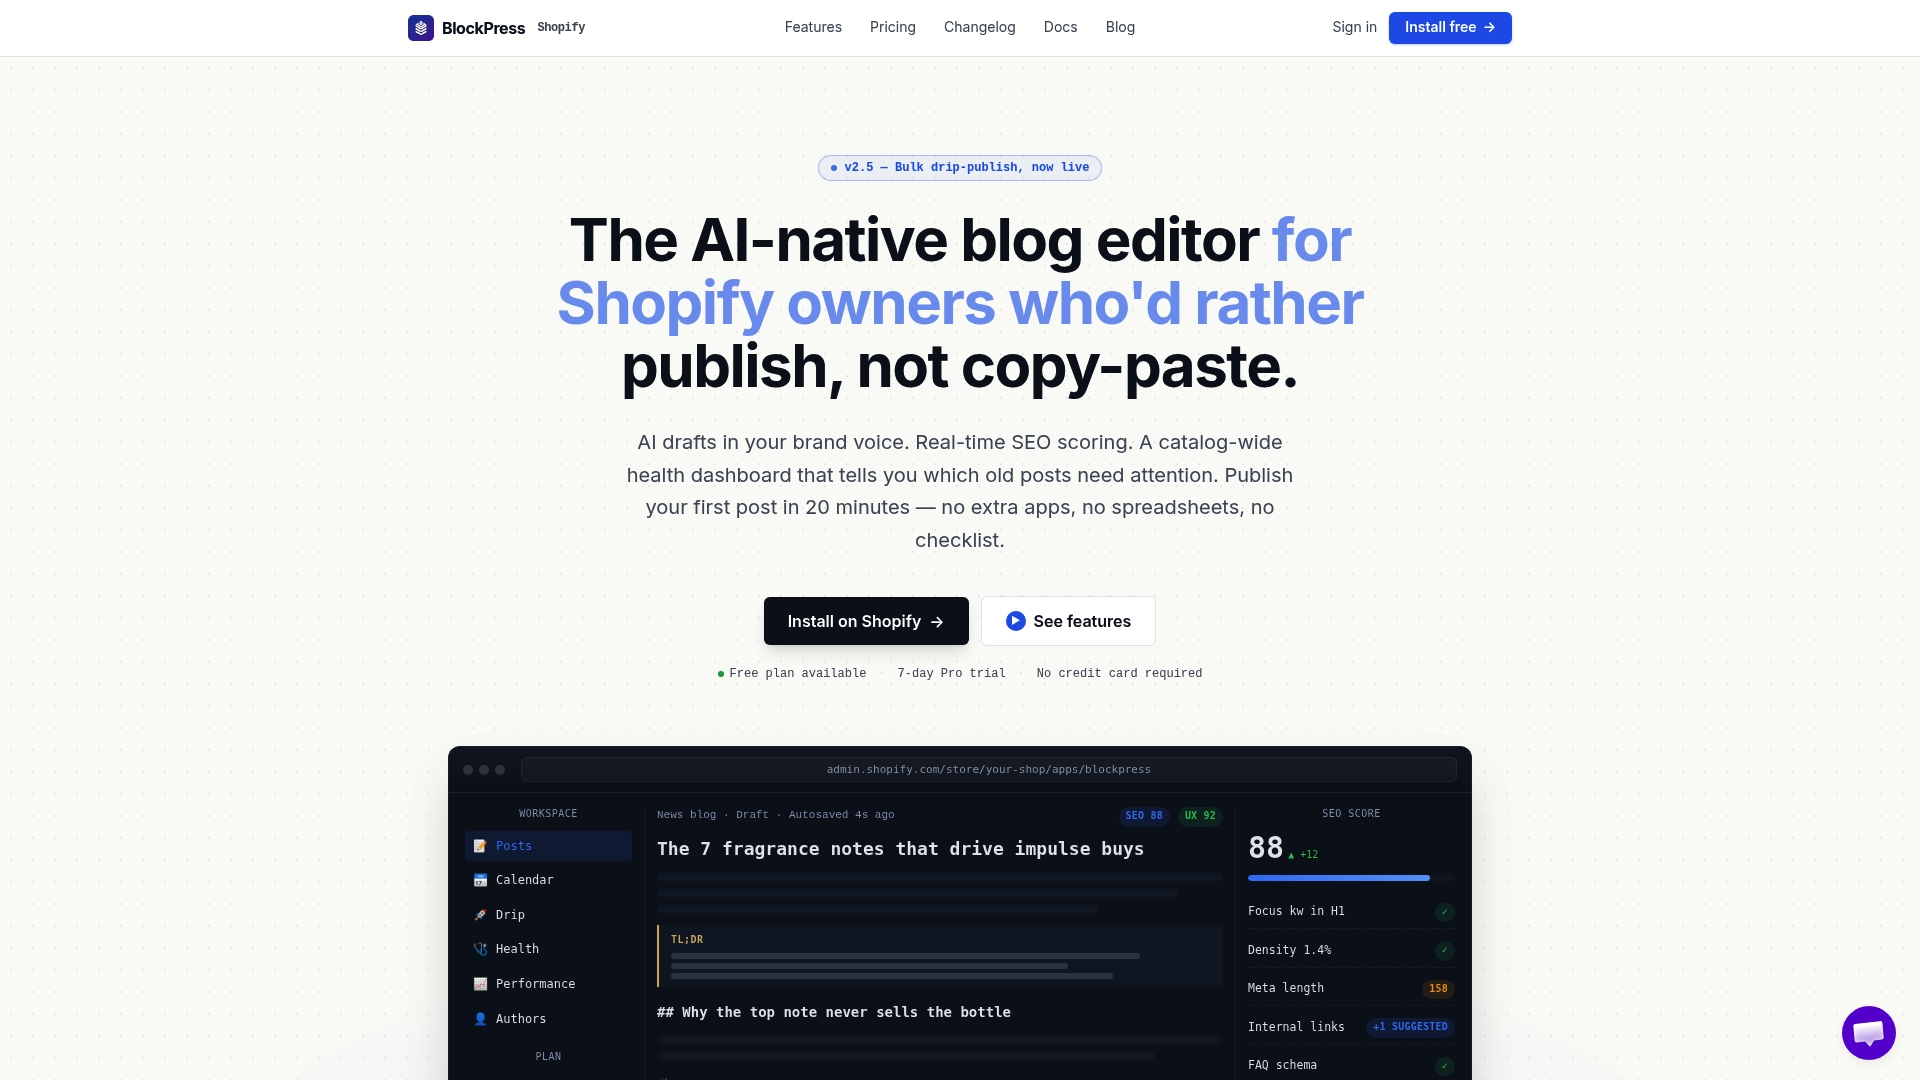
When you publish a post in Blockpress, you can see engagement signals alongside the content itself — no tab-switching, no exporting data. The article health audit flags posts where engagement is underperforming so you know exactly which ones to update first. If you're running a Shopify store and want your blog to drive real traffic and conversions, start with Blockpress and see what your posts are actually doing.
Useful sources
Further reading from the sources that informed this guide:
- GA4 Engagement Rate and Bounce Rate — Google Analytics Help: The official definition of engaged sessions and how bounce rate is derived in GA4.
FAQ
What is bounce rate in GA4 for a blog?
In GA4, bounce rate is the percentage of sessions that were not engaged — meaning the visitor left without spending 10+ seconds on the page, triggering a conversion event, or viewing a second page. It's the inverse of engagement rate.
Is a high bounce rate always bad for a blog?
No. Answer-driven and FAQ posts routinely see bounce rates of 60%–80% and still perform well, because readers found what they needed and left satisfied. Context and page intent matter more than the raw number.
How is bounce rate different from exit rate?
Bounce rate counts sessions where the visitor viewed only one page. Exit rate counts all exits from a specific page, including visitors who navigated from other pages first. A page can have a high exit rate and a low bounce rate.
How do I add bounce rate to my GA4 reports?
GA4 shows engagement rate by default; bounce rate must be added manually. Go to Reports → Engagement → Pages and Screens, then customize the report columns to include "Bounce rate."
Can Blockpress help me track blog engagement on Shopify?
Yes. Blockpress includes per-article performance analytics built into the Shopify editor, so you can monitor engagement signals and act on them without leaving your store dashboard.