
Per-article traffic analytics is the practice of measuring how one individual page, post, or article performs on its own, rather than folding it into your whole site's averages. It matters because a homepage-level bounce rate tells you nothing about whether your "Best Winter Boots 2026" post is actually converting browsers into buyers.
Getting this right unlocks three things you can't do with site-wide dashboards. You can prioritize updates by knowing exactly which posts are decaying and which are climbing. You can measure conversions article-by-article, so a piece that drives 40% of your email signups doesn't get buried under ten pieces that drive none. And you can allocate distribution budget smartly, putting ad spend or social promotion behind the pages that already convert instead of the ones that just get clicks.
The metrics that make this possible aren't exotic. Most of them are sitting in tools you likely already have installed. Here's the core set this article will walk through:
- Pageviews and unique users
- Sessions and entrances
- Engagement time and engagement rate
- Bounce rate (and why GA4 redefined it)
- Scroll depth
- Exits and exit rate
- Conversions and conversion rate per article
- Revenue attributed to a specific page
Key Takeaways
Per-article traffic analytics works because it isolates one page's real performance instead of hiding it inside site-wide averages, letting you prioritize, convert, and promote with precision.
| Point | Details |
|---|---|
| Definition anchors the practice | Per-article analytics measures a single URL's traffic and outcomes, separate from site-wide averages. |
| Track a focused metric set | Pageviews, engagement rate, scroll depth, and conversion rate per article cover most decisions. |
| Setup order matters | Canonicalize URLs first, then install tracking, define events, and QA in real time before trusting data. |
| Review cadence prevents overload | Daily alerts, weekly campaign checks, monthly performance reviews, quarterly ROI decisions. |
| BlockPress keeps action close to data | Per-article analytics, health audits, and SEO scoring live inside the same Shopify editor screen. |
Table of Contents
- What Counts as Per-Article Traffic Analytics?
- What Are the Core Metrics for Per-Article Performance?
- Which Tools Track Per-Article Traffic Best?
- How Do You Set Up Per-Article Tracking?
- What Should a Per-Article Dashboard Include?
- What Do Common Metric Patterns Actually Mean?
- What Data Quality and Privacy Issues Distort Per-Article Numbers?
- How Often Should You Review Per-Article Analytics?
- How Do You Audit Your Per-Article Analytics Setup?
- Where Per-Article Analytics Fits in a Content Program
- How BlockPress Puts Per-Article Analytics to Work
- Sources
- FAQ
What Counts as Per-Article Traffic Analytics?
Per-article traffic analytics tracks data tied to a single URL, canonical page, or article ID, isolated from your site's aggregate numbers. If your blog has 200 posts, this is the practice of looking at post number 147 by itself, not at the average of all 200.
The unit of measurement matters more than it sounds. Most analytics platforms default to grouping by page path, but if your CMS generates duplicate URLs (a ?ref= parameter, a trailing slash variant, a mobile subdomain), you'll end up splitting one article's traffic across three "different" rows in your report. The fix is canonicalization: make sure every variant of a URL points back to one canonical version before you start reading the numbers.
Per-article analytics typically includes these dimensions layered on top of the core metrics:
- Traffic source and medium (organic search, social, email, referral)
- Device category (desktop, mobile, tablet)
- UTM campaign parameters for anything you've actively promoted
- User segment (new vs. returning, logged-in vs. anonymous)
What it doesn't include is just as important. Server-level infrastructure metrics like uptime, response time, or CDN cache hit rate live in your hosting dashboard, not your traffic analytics. Backend inventory or fulfillment events also stay out of scope unless you've explicitly matched them to a page view, which is exactly what revenue-per-article tracking requires you to do deliberately.
Pro Tip: Paginated articles (page 1, page 2, page 3 of a long guide) should either be tracked as one article using content grouping, or reported separately with a clear label. Treating them as one article when they're tracked separately in your analytics tool will make engagement time look artificially short, since readers who paginate are actually staying engaged, just across multiple pageviews.
What Are the Core Metrics for Per-Article Performance?
Nine metrics do almost all the work in a per-article report, and each one answers a different question about reader behavior.
Pageviews counts every time the article loads, including repeat views from the same visitor in one session. It's the volume metric, useful for scale but blind to quality. A post with 50,000 pageviews and a 90% bounce rate is doing something very different than a post with 5,000 pageviews and a 20% bounce rate.

Users (or unique users) counts distinct people, deduplicating repeat visits. The gap between pageviews and users tells you something: a large gap means people are coming back to the same article repeatedly, which is often a signal you've built a reference piece worth bookmarking.
Sessions and entrances track when your article is the first page someone lands on. A high entrance rate relative to total sessions means the article is functioning as a discovery page, usually from search or social, rather than something readers find after browsing your site.
Engagement time (GA4's replacement for the old "average time on page") measures how long a tab was actively in focus, not just open in a background window. This fixed a real problem: the old metric counted tabs left open overnight as hours of engagement, inflating numbers for reasons that had nothing to do with reader interest.
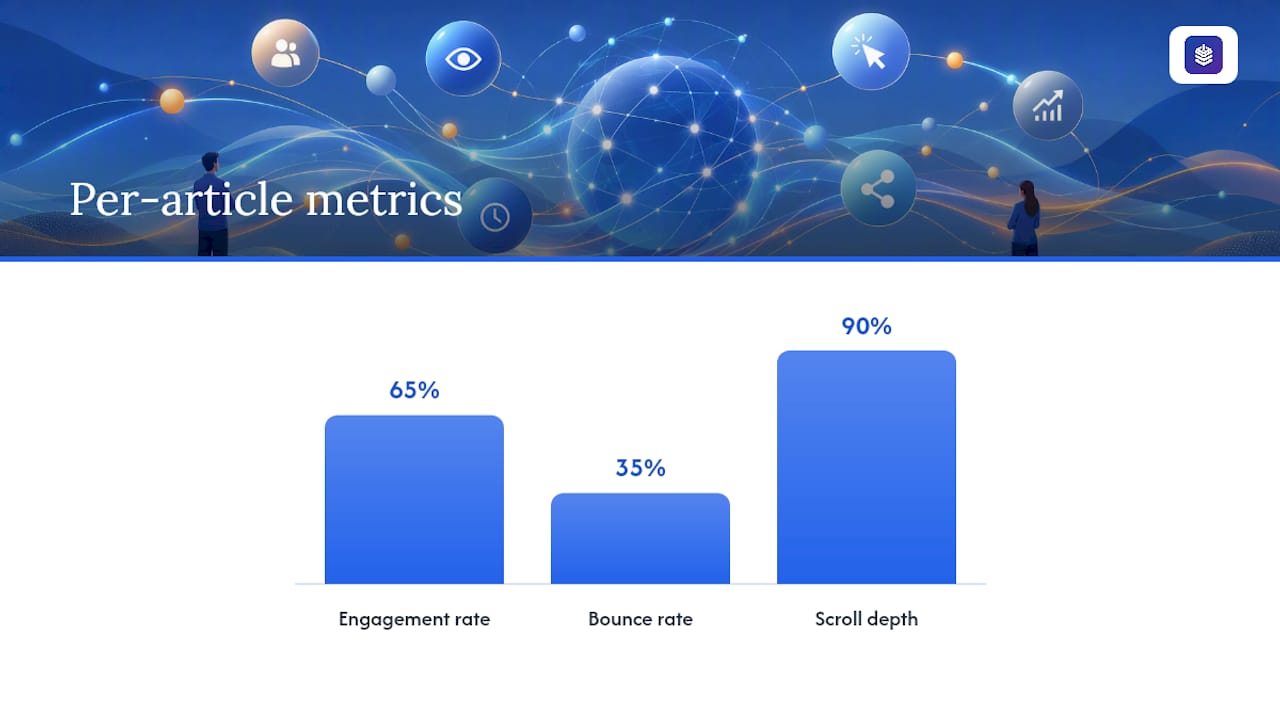
Bounce rate versus engagement rate is where a lot of confusion comes from. GA4 flipped the traditional model: instead of measuring the percentage of single-page sessions with no interaction, it now reports engagement rate, the percentage of sessions lasting 10+ seconds, with a conversion event, or with 2+ pageviews. Bounce rate is just the inverse. If your engagement rate is 65%, your bounce rate is 35%, and you should trust engagement rate as the primary read on quality.
Scroll depth, tracked as a percentage of the page scrolled, is a sharper engagement signal than time on page alone. GA4's enhanced measurement automatically fires a scroll event at 90% depth, giving you a binary "did they reach the end" flag without any custom code. Time on page can be inflated by someone reading the intro and getting distracted; scroll depth can't fake that the same way.
Entrances and exits describe an article's role in the site's funnel. High entrances with high exits means the article works as a self-contained resource, fine for a reference guide, less fine for a product comparison meant to feed into checkout.
Conversions and conversion rate per article are the metrics that connect content to revenue. Conversion events worth tracking per article include newsletter signups, account creation, add-to-cart clicks, and completed purchases where you can attribute the sale back to the entry page.
| Engagement rate | Engaged sessions ÷ total sessions | A typical healthy range for blog content | Bounce rate | 1 minus engagement rate | Lower is better; high values may signal content mismatch | Scroll depth (90%) | Sessions reaching 90% scroll ÷ total sessions | A higher percentage suggests genuinely engaging long-form content | Conversion rate per article | Conversions ÷ users on that article | Conversion rates vary widely by goal and context | Exit rate | Exits ÷ total pageviews on that page | Lower exit rates are preferable when funneling readers
HubSpot's content performance reports show a comparable set of page-level metrics, including page views, bounce rate, time per page, entrances, and total form submissions, refreshed roughly every 20 to 30 minutes, which is fast enough to catch a traffic spike the same day it happens.
Which Tools Track Per-Article Traffic Best?
Five tools cover almost every use case a marketer runs into, and each one has a different default strength.
Google Analytics 4 (GA4) is the free, universal starting point. Its Pages & Screens report shows per-URL traffic out of the box, and Explore lets you build a custom table isolating page path against users, engagement rate, and conversions to find your best-performing posts fast. Scroll tracking and outbound click tracking come free with enhanced measurement, but revenue attribution to a specific article requires custom event setup.
HubSpot (Website Analytics inside Marketing Hub) leans toward marketers already running email and CTA campaigns. Its Blog analyze view surfaces post views, AMP views, bounce rate, and CTA clicks, and breaks down visits by source over the trailing month without any extra configuration. If your CTAs and forms already live in HubSpot, this is the fastest path to a per-article conversion report.
Matomo (and its privacy-hardened cousin, Piwik PRO) is the choice for teams that need page-level analytics without shipping visitor data to a third-party ad network. Self-hosted or EU-hosted deployments give you first-party cookie control and GDPR-friendly consent handling baked into the setup, at the cost of more manual configuration than GA4.
Amplitude was built for product analytics, not blogs, but its journey and funnel tools are genuinely useful when you want to trace what a reader does after leaving an article. Web analytics helps teams see which content draws users and which channels bring engaged visitors, and Amplitude's session-versus-visit distinction is sharper than most CMS-native dashboards.
BlockPress builds per-article performance analytics directly into the Shopify blog editor, so a merchant checking on a post's health doesn't have to leave the writing environment or stitch together a separate reporting tool.
- Fastest setup: GA4 with one custom conversion event configured.
- Best for CTA-driven content: HubSpot, if Marketing Hub already houses your forms.
- Best for privacy-first stacks: Matomo or Piwik PRO.
- Best for post-click journeys: Amplitude.
- Best for Shopify blogs specifically: BlockPress, since it skips the export-and-reconcile step entirely.
Pro Tip: If you only have bandwidth to set up one thing this week, install GA4 and configure a single custom event for your most important conversion (newsletter signup or add-to-cart). One well-defined event beats five vague ones.
How Do You Set Up Per-Article Tracking?
Follow this order, and you'll avoid the most common blind spots that make per-article data untrustworthy later.
- Verify canonicalization first. Confirm every article has one canonical URL and that tracking scripts fire on that canonical version, not on parameter variants or AMP duplicates.
- Install and confirm your tracking code. In GA4, turn on enhanced measurement so scroll tracking, outbound clicks, and file downloads register automatically. In HubSpot, use the debug tool to confirm the tracking pixel fires on page load.
- Define your key events. Decide upfront which actions actually matter: scroll to 90%, time-on-page past 60 seconds, CTA clicks, form submits, and completed purchases. Don't track everything; track what you'll actually act on.
- Set UTM conventions before you promote anything. Agree on a naming structure (source, medium, campaign) across your team so a social push and an email push don't both get lumped under "referral."
- Wire up revenue attribution where it applies. If an article drives affiliate clicks or product sales, connect that purchase event back to the entry page, not just the checkout page.
- QA everything in real time. Load the article yourself, watch it register in GA4's DebugView or HubSpot's real-time report, and check for duplicated pageviews (a common bug from double-firing tracking snippets) or stripped query parameters.
Pro Tip: If your site runs a cookie-consent banner, test your tracking both with consent accepted and declined. A surprising number of setups silently stop firing events entirely when a visitor declines, which quietly erases a chunk of your traffic from the report without any error message.
What Should a Per-Article Dashboard Include?
A useful per-article dashboard has three ingredients: the right fields, the right filters, and a layout you can actually scan in under a minute.
Core fields worth including on every article row:
- Page title and canonical URL
- Users and sessions
- Engagement rate and average engagement time
- Conversions and conversion rate
- Revenue attributed to the page, where applicable
- Top traffic source and device breakdown
- Top referring domains
Filters that make the dashboard usable rather than overwhelming:
- Date range (trailing 30, 90, and 365 days as saved views)
- Source/medium (isolate organic-only or campaign-only traffic)
- Landing pages only, to strip out mid-session pageviews from the read
- Specific UTM campaign, for measuring a single promotion's lift
A single widget example: "Top Article by Conversions, Last 30 Days" pulls page title, conversions, and conversion rate, sorted descending, filtered to organic and direct traffic only. That one card, refreshed weekly, answers the question most content teams actually ask in their Monday meeting: what's working right now?
Publisher-focused tools take this further by adding signups and revenue directly into the article-level table, since standard analytics platforms often don't report revenue per article without added integrations. If monetization is central to your content strategy, that gap is worth closing early rather than discovering it six months into a campaign.
What Do Common Metric Patterns Actually Mean?
Reading the numbers correctly matters more than collecting them. Four patterns show up constantly, and each one points to a different fix.
High traffic, low engagement usually means your title or meta description over-promises relative to the content, or you're ranking for a search intent the article doesn't fully satisfy. The fix is almost never "write more"; it's aligning the opening paragraphs with what the click actually promised.
Low traffic, high conversion rate is a distribution problem, not a content problem. You've built something that works; almost nobody sees it. This is the article to feed into paid promotion or an email send, since the conversion math already checks out.
High bounce from search traffic specifically (as opposed to social or direct) often signals a keyword mismatch: you're ranking for a term where searchers want something your article doesn't deliver. Compare against GA4's Path exploration to see whether readers who don't bounce continue somewhere useful, or just leave regardless.
Traffic spikes from social that don't convert are common and not necessarily a failure. Social traffic tends to browse rather than commit; not every source needs to hit the same conversion bar. The comparison that matters is average engagement time and conversion rate by source, since a smaller, more engaged channel can outperform a larger, shallower one even with fewer total visits.
Turn these patterns into a short weekly triage list (see how to improve user engagement for lasting growth):
- Update articles with high traffic and sub-30% engagement rate first; the upside is largest.
- Republish or actively promote low-traffic, high-conversion posts.
- A/B test titles and meta descriptions on pages with high search-driven bounce.
- Add a stronger mid-article CTA to posts with strong engagement but weak conversion.
For more on turning these signals into edits, see how to fix an underperforming Shopify blog and the mechanics of how blog traffic actually converts to sales.
Pro Tip: Rank fixes by expected lift multiplied by effort, not by whichever metric looks worst. A five-minute meta description rewrite on a high-traffic page usually beats a full rewrite of a low-traffic one, even if the low-traffic page's numbers look more broken.
What Data Quality and Privacy Issues Distort Per-Article Numbers?
Bad data quietly wrecks per-article decisions before you even notice, and a handful of causes account for most of it.
Bot traffic inflates pageviews on articles that get crawled heavily, particularly older, high-authority posts. Most platforms offer built-in bot filtering, but it's worth confirming it's actually enabled rather than assumed.
Duplicate pageviews, usually from a tracking snippet firing twice on page load, make engagement metrics look worse than reality by splitting one real session into two recorded ones. Query-parameter fragmentation does the opposite kind of damage: it splits one article's traffic across a dozen "different" URLs, each looking individually low-performing when combined they're actually solid.
Cross-device attribution breaks conversion tracking specifically. A reader who finds your article on mobile, then converts on desktop three days later, often shows up as two unconnected sessions rather than one attributed journey, understating your true conversion rate.
On the privacy side, consent banners change what you can measure and how. Server-side tracking has grown more common precisely because it keeps some measurement intact even when a browser blocks third-party cookies, though it comes with its own governance overhead around what data gets stored and for how long.
Practical fixes, in priority order:
- Enable bot filtering in your analytics platform's settings, not just assume it's on.
- Canonicalize URLs before analysis, stripping tracking parameters from your reporting view.
- Standardize UTM naming across your whole team, in writing, before your next campaign.
- Deduplicate events by auditing your tracking code for double-firing snippets.
Pro Tip: Reconcile your analytics conversion count against your actual server-side purchase log monthly. A gap of more than 10 to 15% usually means an attribution or tracking bug, not a change in customer behavior, and it's worth chasing down before you trust revenue-per-article numbers for budget decisions.
How Often Should You Review Per-Article Analytics?
Review cadence should match decision speed, not calendar convenience. Checking every metric daily creates noise; checking everything quarterly means you miss problems for months.
Daily checks are for alerts only: a sudden traffic drop on a revenue-driving article, or a spike that might signal a broken tracking event. Weekly reviews cover active campaigns: how a newly published or newly promoted article is trending against its first-week benchmark. Monthly reviews are for full content performance: which articles gained or lost engagement rate, which need updates. Quarterly reviews step back further, looking at content ROI and deciding what enters the update backlog for the next three months.
Core KPIs worth anchoring each review around:
- Organic users (growth or decay trend, not just a raw number)
- Engagement rate (50 to 65% is a reasonable healthy band for most blog content)
- Conversions and conversion rate per article
- Revenue per article, where monetization applies
- Average engagement time relative to your typical read length
Those two thresholds catch most real problems without triggering false alarms over normal week-to-week fluctuation.
For a broader KPI framework beyond per-article metrics alone, see content marketing KPIs worth tracking.
How Do You Audit Your Per-Article Analytics Setup?
Run this checklist quarterly, or any time a number looks suspicious and you need to figure out whether it's a content problem or a tracking problem.
Completeness checks:
- Confirm tracking code fires on every canonical article page, not just the homepage and templates.
- Verify CTA and conversion events are wired up on every article that has a CTA, not just your top ten posts.
- Check scroll tracking is enabled site-wide, not just on a handful of manually configured pages.
Accuracy checks:
- Compare your analytics platform's conversion count against server-side commerce or form data for the same period.
- Spot-check a live article in a debug or real-time view to confirm events fire correctly and only once.
Governance checks:
- Review UTM naming for consistency across the last quarter's campaigns.
- Confirm access controls limit who can edit tracking configuration.
- Check data retention and anonymization settings match your current privacy policy.
If you're running this audit on a Shopify blog, cross-reference it against a broader blog health audit checklist to catch related SEO and content issues at the same time, since tracking gaps and content decay tend to cluster on the same neglected posts.
Where Per-Article Analytics Fits in a Content Program
Most content teams still treat analytics as a report they generate after the fact instead of a product signal that should shape what gets written next. That's backward. Per-article data works best when it's treated the same way a product team treats usage metrics: a feedback loop that decides the next sprint, not a scorecard for the last one.
The gap between "we have analytics" and "we act on analytics" is where most content strategies actually fail. A dashboard full of engagement rates means nothing if nobody triages it into a content ROI decision every month. Working with Shopify merchants across different niches makes one pattern obvious: stores that treat each article as its own small product, with its own conversion goal and its own performance bar, consistently outgrow stores that publish and forget. The tools matter less than the habit of checking them.
BlockPress was built around that premise: performance data belongs inside the same screen where the writing happens, not in a separate tab you forget to open.
How BlockPress Puts Per-Article Analytics to Work
BlockPress bundles per-article performance analytics directly into the Shopify blog editor, so a merchant reviewing a post's numbers never has to leave the writing screen or export data into a spreadsheet. That matters more than it sounds. The tools discussed above (GA4, HubSpot, Matomo, Amplitude) are all genuinely capable, but each one requires you to build a separate habit of logging in, filtering, and interpreting before you can act on what you find.
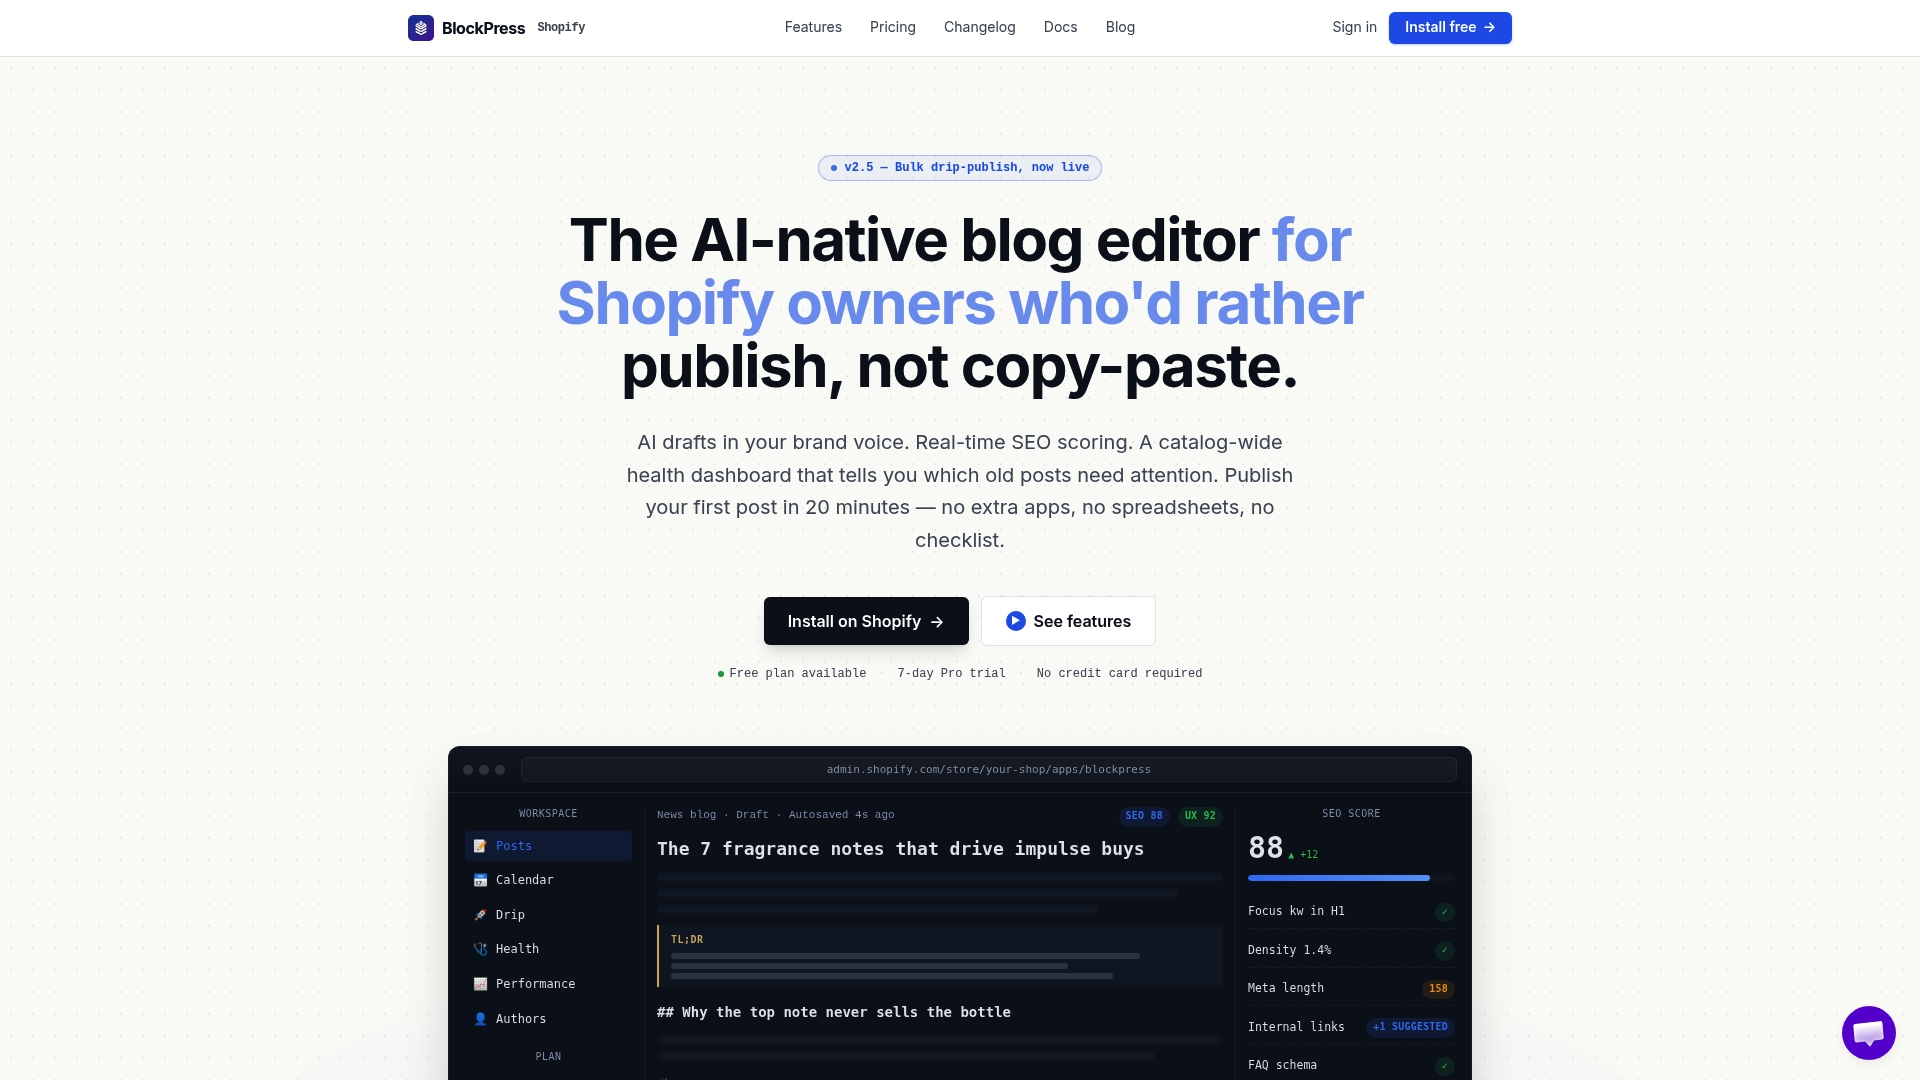
Inside BlockPress, the article editor surfaces engagement metrics, health audit flags, and live SEO scoring right next to the draft you're editing, alongside revenue tracking tied to individual posts where store data supports it. A merchant checking why a product guide stopped converting can see the engagement drop and the outdated internal links in the same view, then fix both without switching tools. That closes the loop between measurement and action, which is exactly the gap that turns most analytics dashboards into reports nobody reads twice.
If you're managing a Shopify blog and tired of stitching together GA4 exports with a separate SEO tool and a third app for content audits, BlockPress replaces that stack with one editor. Check the pricing page to see which plan fits your catalog size and start tracking your next article from the moment you publish it.
Sources
A handful of official docs and explainers cover almost everything referenced above in more depth:
- Analyze individual content performance
- Web analytics (Amplitude blog)
- How to Find Your Best-Performing Blog Posts in GA4 | Emilytics
FAQ
What is per-article traffic analytics?
Per-article traffic analytics is the measurement of visitor behavior and outcomes tied to one specific page or post, including pageviews, engagement rate, and conversions, rather than site-wide averages.
Is there a way to track how much traffic a website gets, article by article?
Yes. GA4's Pages & Screens report, HubSpot's content analyze view, Matomo, Amplitude, and BlockPress all report traffic broken down by individual URL, with varying levels of default detail and custom setup required.
What are the four main types of data analytics?
The four broad categories are descriptive (what happened), diagnostic (why it happened), predictive (what's likely to happen), and prescriptive (what to do about it); per-article traffic reports are primarily descriptive and diagnostic tools.
How do I get more consistent daily traffic to an article?
Consistent traffic usually comes from a mix of ongoing SEO optimization, a distribution plan that revisits older high-performing posts, and fixing engagement issues flagged by metrics like bounce rate and scroll depth rather than chasing one large traffic spike.
What is the 10-90 rule in web analytics?
There's no single standardized "10-90 rule" in web analytics; if you've seen it referenced, it typically points to the idea that a small share of your content or traffic sources drives most of your results, which is why prioritizing your top-performing articles matters more than treating every post equally.
Can BlockPress show revenue generated by a specific article?
BlockPress tracks per-article performance analytics within the Shopify blog editor, including engagement and conversion signals tied to individual posts, giving merchants a direct view of which articles are driving results.